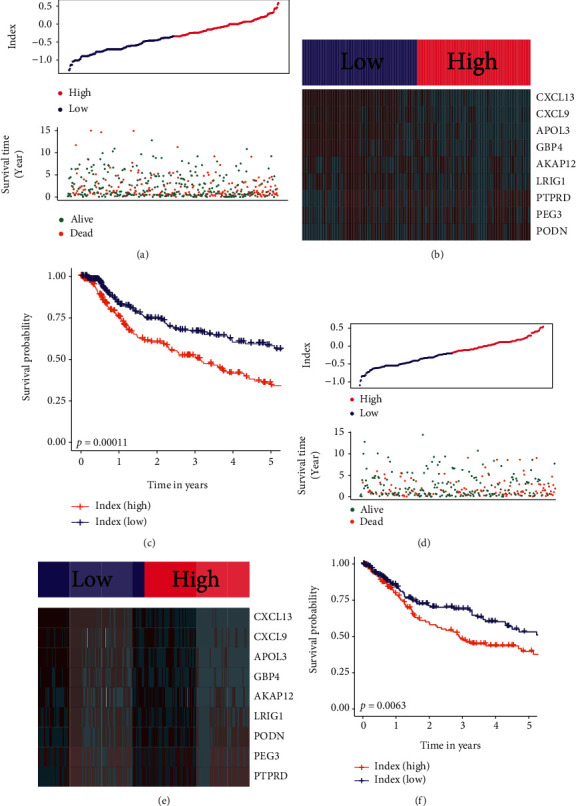
Figure 5.

Analysis of prognosis signatures in the training and testing datasets. (a) Distribution of prognostic index and surviving condition in the low and high prognostic index groups from the training dataset. (b) Expression values of genes between two groups in the training dataset. Red color represents high expression value, and green color represents low expression value. (c) Survival curves of the high- and low-index groups in the training dataset. (d) Distribution of prognostic index and surviving condition in the low and high prognostic index groups from the testing dataset. (e) Expression values of genes between two groups in the testing dataset. Red color represents high expression value, and green color represents low expression value. (f) Survival curves of the high- and low-index groups in the testing dataset.
