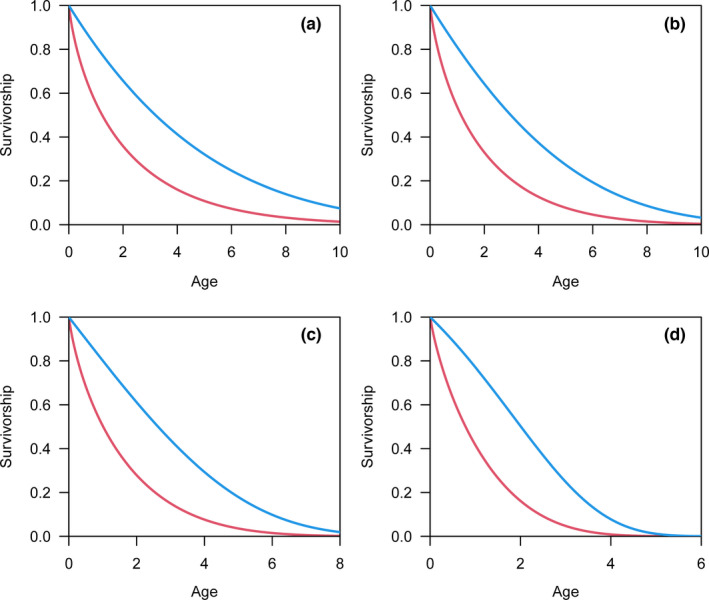
FIGURE 4.

The survivorship curves based on real lifespan (blue lines) and reported lifespan (red lines). The simulated data were generated by Gompertz distributions with aging rates equal to 0.05 (a), 0.1 (b), 0.2 (c), and 0.5 (d). As the aging rate increases, the convexity of the survivorship curve based on real lifespan (blue lines) is increasingly evident, while survivorship curves are almost concave based on reported lifespans (red lines)
