
FIGURE 6.
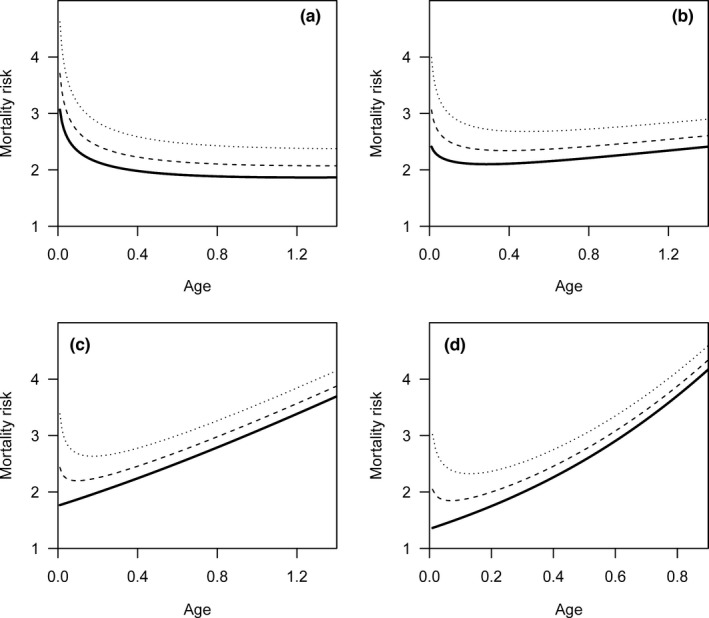
The change in mortality risk against age based on reported lifespan is not affected by m 0 (i.e., age‐independent mortality risk) in the Weibull model. m 0 is equal to 0 for the blank lines; m 0 is equal to 0.2 for the dashed lines; m 0 is equal to 0.5 for the dotted lines. The trajectories correspond to the Weibull model with shape parameters equal to 1.25 (a), 1.5 (b), 2 (c), and 3 (d)