Figure 5.
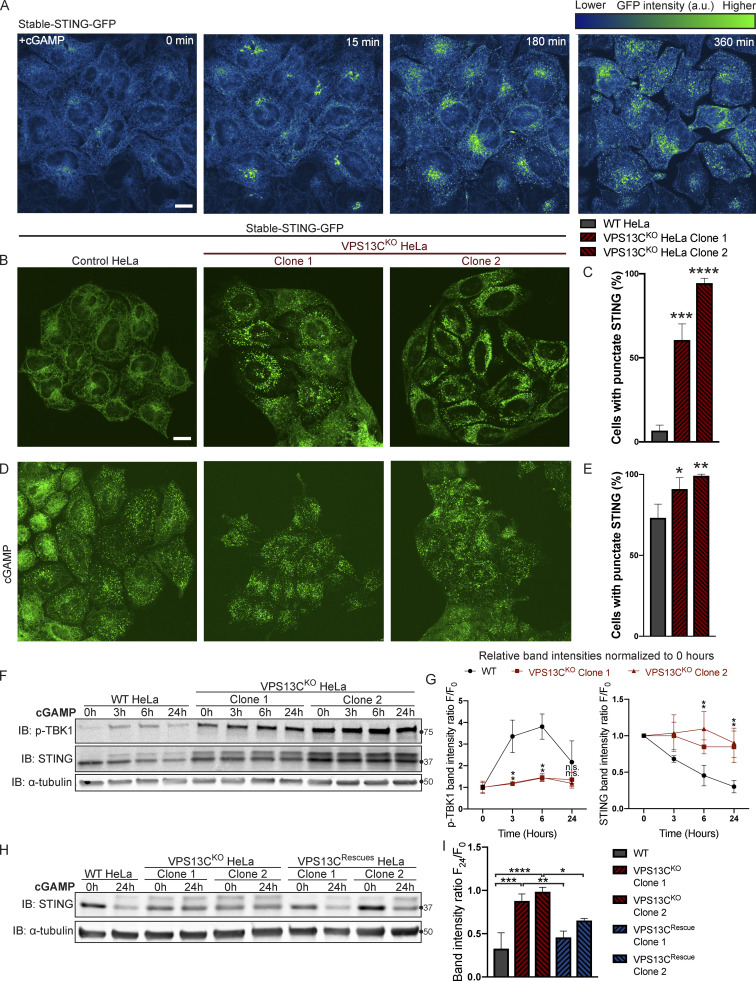
STING is activated and translocated out of the ER at baseline in VPS13CKO cells. (A) Selected frames from time lapse of stable STING-GFP in WT HeLa cells after treatment with 50 µg/ml cGAMP (Video 1). The GFP signal is shown using the “Green Fire Blue” lookup table in ImageJ, in which lower intensities are displayed in blue and higher intensities are displayed in green, a key for which is shown at top right. STING-GFP is localized in an ER-like pattern 0 min after treatment and traffics to a Golgi-like pattern 15 min after treatment, a Golgi/vesicular pattern by 180 min after treatment, and a largely vesicular pattern by 360 min. (B) Under unstimulated basal conditions, STING-GFP is localized in an ER distribution in WT HeLa cells but a vesicular distribution in the majority of VPS13CKO cells. (C) The percentage of cells with vesicular pattern is quantified in C. n = 3 biological replicates. (D and E) treatment with cGAMP had only minimal effect on the already punctate distribution of STING-GFP in VPS13CKO cells, but induces a vesicular pattern in the majority of WT cells (D), quantified in E. n = 3 biological replicates. (F) In WT cells, treatment with 8 µg/ml cGAMP causes an increase in p-TBK1 at 3 and 6 h time points and a return to baseline at 24 h, along with a concomitant decrease in total STING levels over 24 h as STING is degraded. In VPS13CKO cells, the same treatment fails to cause a significant increase in p-TBK1, STING upper band (phospho-STING), or decrease in total STING levels. (G) Band intensity of p-TBK1 and STING at each time point is quantified relative to the 0-h value for each cell line. For quantification of the STING bands, both the upper and lower band were included. All bands were normalized to the loading control. n = 3 biological replicates. (H and I) Treatment with 8 µg/ml cGAMP in VPS13CRescue cells for 24 h results in STING degradation closer to WT levels, but fails to induce significant STING degradation in VPS13CKO cells (H), quantified in I. n = 3 biological replicates. Scale bars, 20 μM. *, P < 0.05; **, P < 0.01; ***, P < 0.001; ****, P < 0.0001 compared with WT control. cGAMP time course data were compared using two-way ANOVA followed by FDR multiple comparisons testing. All other data were compared using two-sided t tests. Error bars represent ±SD. Source data associated with this figure can be found at https://doi.org/10.5281/zenodo.6416363. Source data are available for this figure: SourceData F5.

