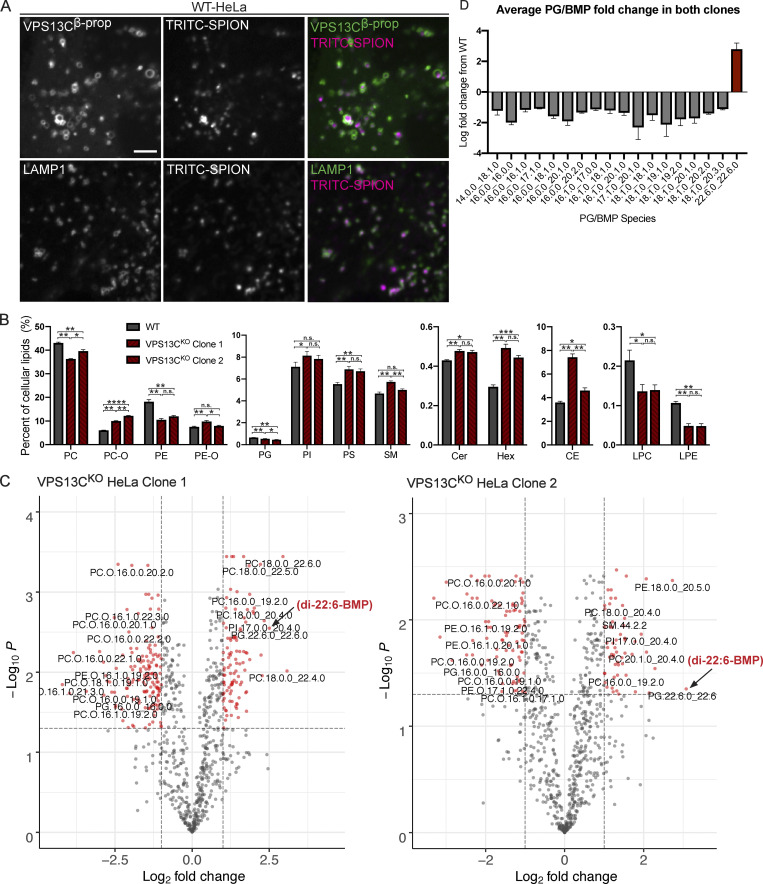
Figure S2.
Lipidomics of whole-cell and purified lysosomes. (A) Colocalization of TRITC-labeled SPIONs with overexpressed GFP-VPS13Cβprop (top row) or LAMP1-GFP (bottom row) after 4-h pulse and 15-h chase. Scale bar, 5 μm. (B) Percentages of lipid classes in WT and VPS13CKO whole-cell lysate normalized to total measured cell lipid content. n = 3 biological replicates. (C) Volcano plots of individual lipid species in VPS13CKO purified lysosomes. Species that surpass the q-value and fold-change thresholds are shown as red dots. Lipid species labels are centered under corresponding dot. Arrows show PG.22.6.0_22.6.0/di-22:6-BMP. (D) Barplot showing the average fold-change of PG/BMP species in both clones. n = 3 biological replicates. Only species with q values < 0.05 are shown. For lipidomic data, *, q < 0.05; **, q < 0.01; ***, q < 0.001. For all other data, *, P < 0.05; **, P < 0.01; ***, P < 0.001; ****, P < 0.0001 compared with WT control. Lipidomic data in C were compared using FDR. All other data were compared using two-sided t tests. Error bars represent ±SD. Source data associated with this figure can be found at https://doi.org/10.5281/zenodo.6416363.

