Figure S3.
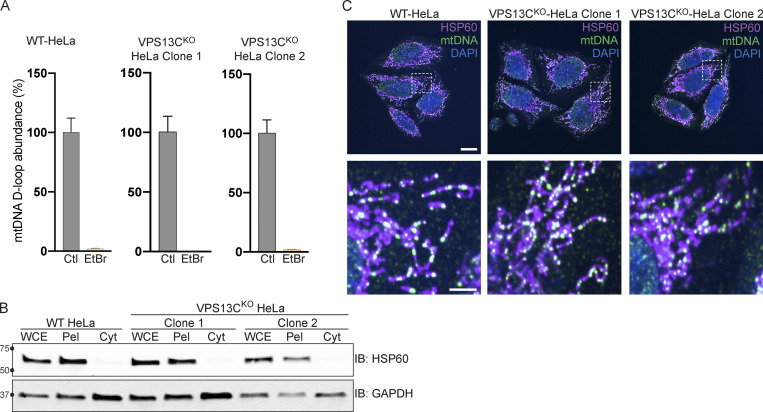
Control experiments for data shown in Fig. 4 and normal mtDNA nucleoid morphology in VPS13CKO cells. (A) qPCR of a D-Loop mtDNA amplicon relative to the nuclear gene hB2M shows efficient depletion of mtDNA after treatment with EtBr. The controls reflect each of the cell lines (WT, VPS13CKO clone 1, and VPS13CKO clone 2) grown in normal media. n = 3 biological replicates. (B) IB showing that mitochondrial marker HSP60 is present in the whole cell extract (WCE) and pellet (Pel) but absent in the cytosolic fraction (Cyt), while the cytosolic marker GAPDH is present in all fractions. (C) Immunofluorescence showing that mitochondria (magenta) and mtDNA nucleoids (green) have grossly normal morphology in VPS13CKO HeLa cells. Scale bar, 20 μm. Inset scale bars, 5 μm. Error bars represent ±SD. Source data associated with this figure can be found at https://doi.org/10.5281/zenodo.6416363. Source data are available for this figure: SourceData FS3.

