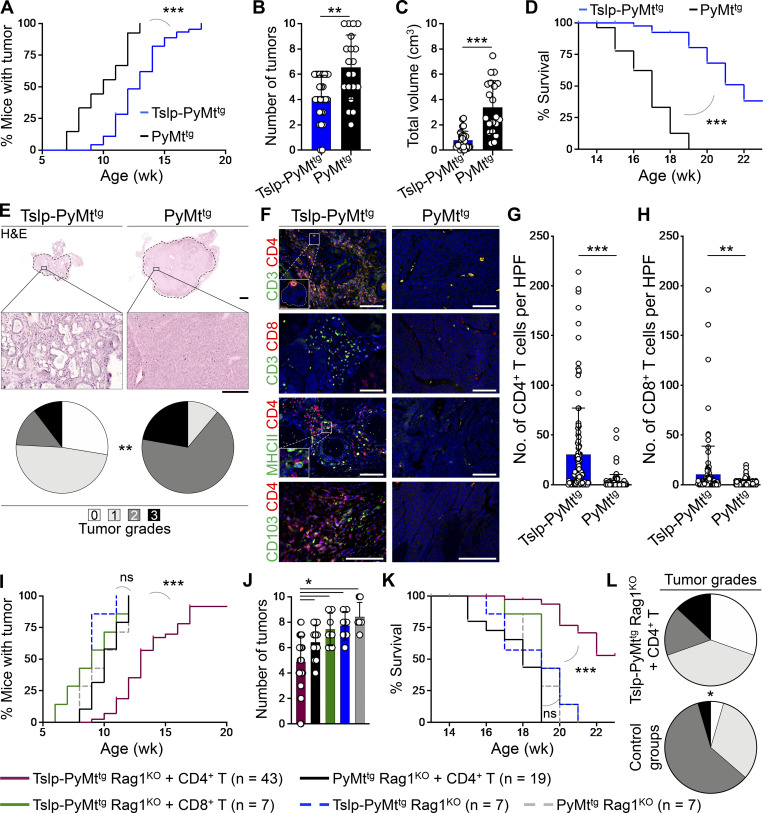
Figure 1.
TSLP-induced CD4+ T cell immunity transforms high-grade breast tumors into fibrocystic structures. (A) Time to tumor onset in K14-Tslptg, MMTV-PyMTtg (Tslp-PyMttg; n = 46) and PyMttg (n = 27) mice (log-rank test). (B) Number of palpable tumors in each Tslp-PyMttg (n = 28) and PyMttg (n = 20) mouse at 18–20 wk of age (Mann–Whitney U test). Bar graph shows mean + SD. (C) Sum of the volumes of all tumors in each Tslp-PyMttg (n = 28) and PyMttg (n = 20) mouse at 18–20 wk of age (Mann–Whitney U test). Bar graph shows mean + SD. (D) Percentage survival of Tslp-PyMttg (n = 46) and PyMttg (n = 27) mice (log-rank test). (E) Representative images of H&E-stained primary Tslp-PyMttg and PyMttg tumors at low (scale bar: 1 mm) and high (scale bar: 100 μm) magnifications, and the distribution of histological grades of Tslp-PyMttg (n = 29) and PyMttg (n = 18) breast tumors (Fisher’s exact test). (F) Representative images of CD3/CD4, CD3/CD8, MHCII/CD4, and CD103/CD4 immunofluorescence staining on Tslp-PyMttg and PyMttg tumors (scale bar: 100 μm). Inset in CD3/CD4 image shows a CD4+ T cell within the epithelial compartment of a differentiated Tslp-PyMttg breast tumor. Inset in MHCII/CD4 image highlights the interaction of CD4+ T cells with the APCs within Tslp-PyMttg tumor microenvironment. (G and H) Quantification of CD4+ T cells (G) and CD8+ T cells (H) in Tslp-PyMttg and PyMttg tumors. CD3/CD4 and CD3/CD8 double-positive cells counted in 10 HPF images in 11 tumor samples per group. HPF images for each sample were chosen randomly across the tumor section. Each dot represents one HPF image (unpaired t test). Bar graphs show mean + SD. (I) Time to tumor onset in Tslp-PyMttg Rag1KO + CD4+ T cells, PyMttg Rag1KO + CD4+ T cells, Tslp-PyMttg Rag1KO + CD8+ T cells, Tslp-PyMttg Rag1KO, and PyMttg Rag1KO T cells (P < 0.0001 for Tslp-PyMttg Rag1KO +CD4+ compared with PyMttg Rag1KO +CD4+ T cell; no statistical difference among the other groups [ns], log-rank test). (J) Number of palpable tumors at endpoint (≥18 wk old) in the five groups of mice (Mann–Whitney U test). Bar graph shows mean + SD. (K) Percentage survival in the five groups of animals (P < 0.0001 for Tslp-PyMttg Rag1KO + CD4+ compared with PyMttg Rag1KO + CD4+ T cell, no statistical difference among the other groups [ns]; log-rank test). (L) Distribution of histological grades of Tslp-PyMttg Rag1KO + CD4+ T cell tumors compared with all other groups combined (control groups, Fisher’s exact test). Each of the tumors in the studies is from a separate mouse. All experimental data verified in at least two independent experiments. *, P < 0.05; **, P < 0.01; ***, P < 0.0001.

