Figure 3.
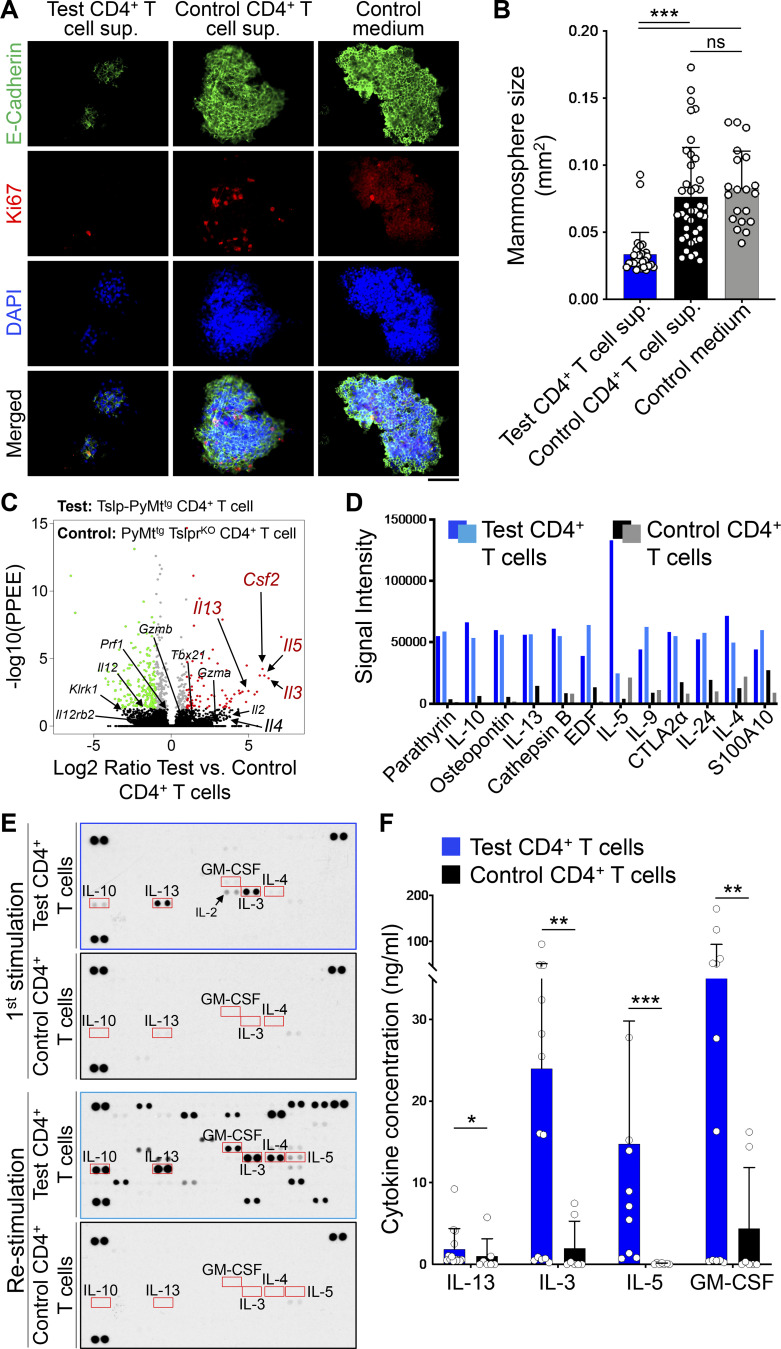
CD4+ T cells directly suppress breast epithelial cell proliferation. (A) Representative images of HC11 mammosphere immunofluorescence staining after exposure to supernatants derived from Tslp-PyMttg CD4+ T cells (test CD4+ T cell sup.), PyMttg TslprKO CD4+ T cells (control CD4+ T cell sup.), or cell culture medium (control medium). Equal total protein amounts of supernatants from second and third rounds of CD4+ T cell stimulation were used. Mammospheres were stained for E-cadherin (green), Ki67 (red), and DAPI (blue, scale bar: 100 μm). (B) Quantification of mammosphere size in test CD4+ T cell sup. (n = 20), control CD4+ T cell sup. (n = 40), and control medium (n = 30) conditions. Each dot represents one mammosphere (Mann–Whitney U test). Bar graph shows mean + SD. (C) Volcano plot showing significantly upregulated (red dots) and downregulated (green dots) genes in CD4+ T cells isolated from Tslp-PyMttg mice (test, n = 6) compared with CD4+ T cells isolated from PyMttg TslprKO mice (control, n = 4, log2 ratio > |1| and −log10 of posterior probability of equal expression [PPEE] >1.3 is considered significant). Genes of interest are indicated with their symbol. (D) Bar graph showing the top 12 secreted proteins detected in two Tslp-PyMttg CD4+ T cell (test) compared with two PyMttg TslprKO CD4+ T cell (control) supernatants determined using multiplexed quantitative mass spectrometry. Supernatants were from second and third rounds of CD4+ T cell stimulation. (E) Image of protein arrays performed on CD4+ T cell supernatants from test (first and third arrays) and control (second and last arrays). Supernatants used in this assay were collected after a first round of CD4+ T cell stimulation ex vivo (top two arrays) or after the second round of stimulation (bottom two arrays). Equal total protein amount of each supernatant was used in this assay. Red boxes highlight Th2-related cytokines differentially detected in test versus control samples. (F) Quantification of protein concentration, measured with ELISA, in test CD4+ T cell supernatants compared with control CD4+ T cell supernatants. Supernatants used in this assay were collected after T cell stimulation. Supernatants were from first and second rounds of CD4+ T cell stimulation (Mann–Whitney U test). Bar graph shows mean + SD. The same amount of total protein for each sample was used for protein detection and quantification in D, E, and F. All experimental data verified in at least two independent experiments. *, P < 0.05; **, P < 0.01; ***, P < 0.0001.

