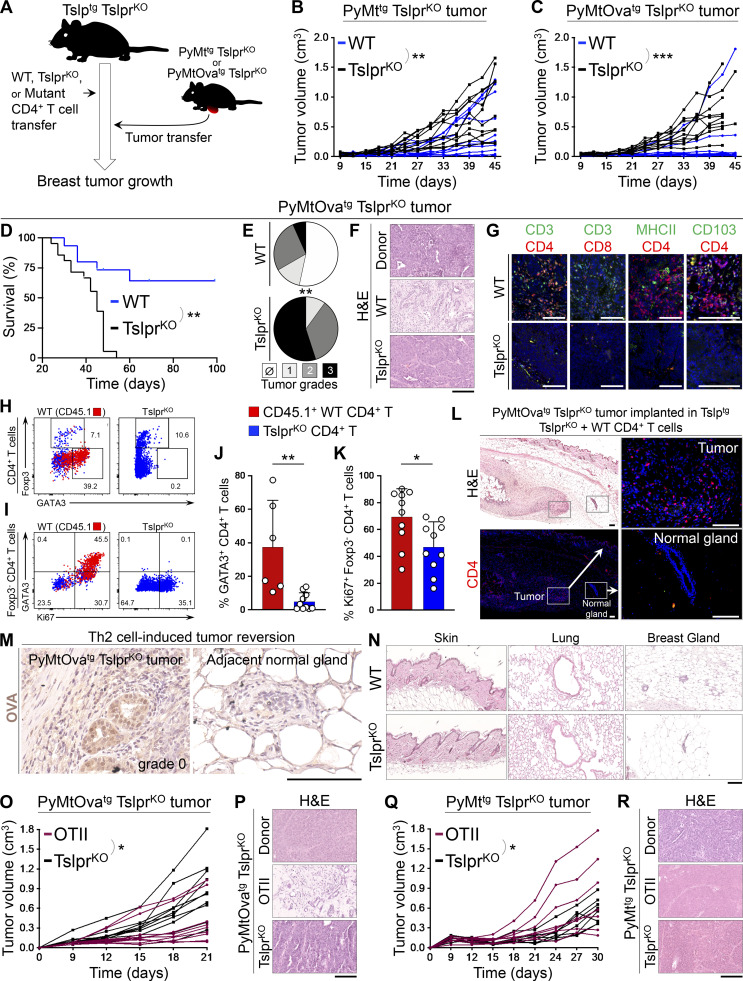
Figure 5.
Antigen specificity of Th2 cell immunity against breast carcinogenesis. (A) Schematic diagram of the experimental paradigm used to elucidate the effector mechanism of TSLP-stimulated CD4+ T cells against breast cancer. Note that only transferred CD4+ T cells in the test groups express TSLP receptor (Tslpr), but all other cells including the implanted tumor cells lack TSLP receptor (i.e., TslprKO). (B) Spider plot of PyMttg TslprKO primary breast tumor growth in Tslptg TslprKO mice injected with WT (test, n = 10, 6/10 tumors were <0.5 cm3 at the endpoint) versus TslprKO (control, n = 10, 4/10 tumors were <0.5 cm3 at the endpoint) CD4+ T cells (two-way ANOVA). (C) Spider plot of PyMtOvatg TslprKO primary tumor growth in Tslptg TslprKO mice injected with WT (n = 10, 9/10 tumors were <0.5 cm3 at the endpoint) versus TslprKO (n = 10, 2/10 tumors were <0.5 cm3 at the endpoint) CD4+ T cells (two-way ANOVA). (D) Survival rate of Tslptg TslprKO mice injected with WT (n = 15) versus TslprKO (n = 19) CD4+ T cells followed by PyMtOvatg TslprKO primary tumor implantation (log-rank test). (E) Distribution of histological grades of PyMtOvatg TslprKO primary tumors developed in Tslptg TslprKO mice injected with WT (n = 15) versus TslprKO (n = 20) CD4+ T cells (Fisher’s exact test). (F) Representative images of H&E-stained PyMtOvatg TslprKO breast tumors from (top to bottom): tumor donor, Tslptg TslprKO mouse injected with WT CD4+ T cells, and mouse injected with TslprKO CD4+ T cell. Note the degree of breast tumor differentiation in WT (test) group compared with the original tumor harvested from the donor mouse and TslprKO (control) group. (G) Representative images of CD3/CD4, CD3/CD8, MHCII/CD4, and CD103/CD4 immunofluorescence staining on PyMtOvatg TslprKO primary tumors developed in Tslptg TslprKO mice injected with WT versus TslprKO CD4+ T cells. Note that CD103 colocalizes with CD4 and CD3 on few cells in the WT tumors (scale bars, 100 μm). (H and I) Representative flow plots showing percentage GATA3+ Th2 and Foxp3+ regulatory T cells (Tregs) in PyMtOvatg TslprKO breast tumors of Tslptg TslprKO mice injected with CD45.1+ WT versus TslprKO CD4+ T cells (H) and percentage GATA3+ and Ki67+ cells among tumor-infiltrating Foxp3− CD4+ T effector cells in Tslptg TslprKO mice injected with WT or TslprKO CD4+ T cells (I). Injected CD45.1+ WT CD4+ T cells are highlighted in red; TslprKO CD4+ T cells are in blue. Numbers on the plots represent the percentage of cells within each gate. (J and K) Percentage GATA3+ Th2 cells among CD45.1+ WT CD4+ T cells (test, n = 6) versus TslprKO CD4+ T cells (control, n = 10; J) and Ki67+ cells among CD45.1+ WT Foxp3− CD4+ T cells (test, n = 10) versus TslprKO Foxp3− CD4+ T cells (control, n = 10; K) isolated from PyMtOvatg TslprKO breast tumors developed in Tslptg TslprKO mice (Mann-Whitney U test). Bar graphs show mean + SD. (L) H&E and immunofluorescence images show breast tumor and adjacent mammary gland of a Tslptg TslprKO mouse injected with WT CD4+ T cells and implanted with PyMtOvatg TslprKO tumor. CD4 immunofluorescence staining highlights CD4+ T cells infiltrating the tumor, but not the adjacent normal mammary gland of the mouse (insets: scale bars, 100 μm). (M) Representative images of immunohistochemical staining for OVA in breast tumor and adjacent mammary gland of Tslptg TslprKO mice implanted with high-grade PyMtOvatg TslprKO tumor. Note that CD4+ Th2 cell immunity suppressed an OVA-expressing tumor by transforming it to gland-like structures while sparing the OVA-negative adjacent mammary glands (scale bar: 100 μm). (N) Representative images of H&E-stained skin, lung, and mammary glands of Tslptg TslprKO mice injected with WT versus TslprKO CD4+ T cells and implanted with PyMtOvatg TslprKO tumor. No sign of inflammation is detected in the nontumor tissues at the endpoint (scale bar: 100 μm). (O) Spider plot showing PyMtOvatg TslprKO primary tumor growth in Tslptg TslprKO mice injected with OTII (n = 9, 7/9 tumors were <0.5 cm3 at the endpoint) versus TslprKO (n = 10, 2/10 tumors were <0.5 cm3 at the endpoint) CD4+ T cells (two-way ANOVA). (P) Representative images of H&E-stained PyMtOvatg TslprKO breast tumors from (top to bottom): tumor donor, tumor recipient mice injected with OTII, or TslprKO CD4+ T cells (scale bar: 100 μm). (Q) Spider plot of PyMttg TslprKO primary tumor growth in Tslptg TslprKO mice injected with Ova-specific CD4+ T cells (OTII, n = 7, 3/7 tumors were <0.5 cm3 at the endpoint) versus TslprKO CD4+ T cells (n = 8, 3/8 tumors were <0.5 cm3 at the endpoint, two-way ANOVA). (R) Representative images of H&E-stained PyMttg TslprKO breast tumors from (top to bottom): tumor donor mouse, mouse injected with OTII CD4+ T cells, and mouse injected with TslprKO CD4+ T cells (scale bar: 100 μm). Each of the tumors in the studies is from a separate mouse. All experimental data verified in at least two independent experiments. *, P < 0.05; **, P < 0.01; ***, P < 0.0001.

