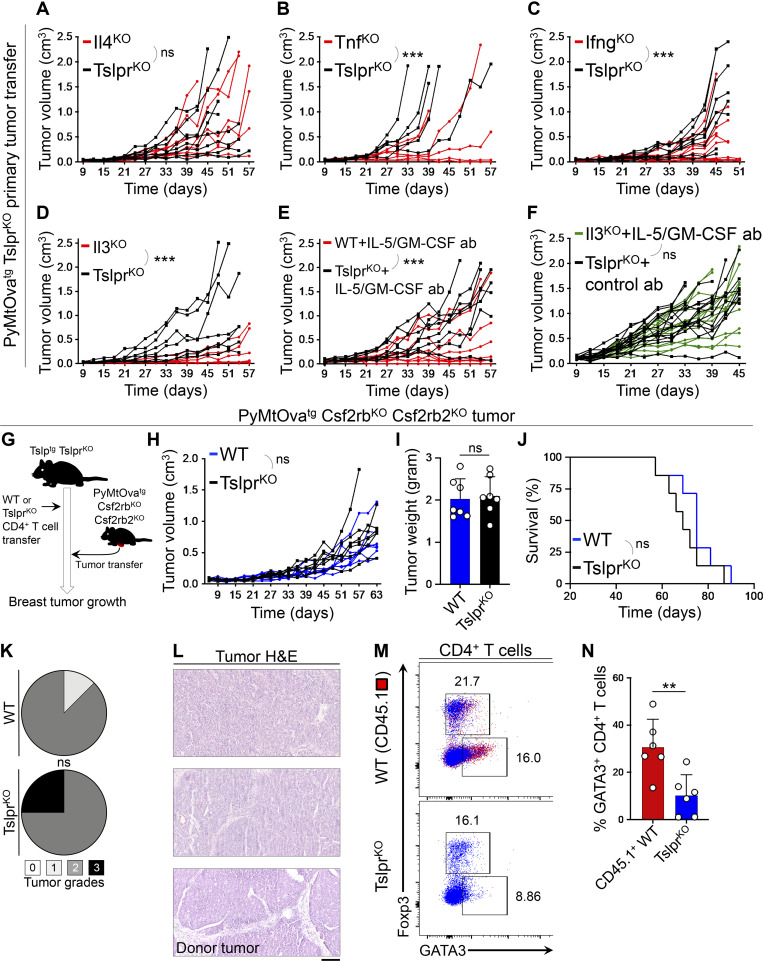
Figure 6.
IL-3, IL-5, and GM-CSF cytokines mediate Th2 cell immunity against breast carcinogenesis. (A–C) Spider plots of PyMtOvatg TslprKO primary tumor growth in Tslptg TslprKO mice injected with Il4KO (n = 8, 2/8 tumors were <0.5 cm3 at the endpoint; A), TnfKO (n = 6, 2/6 tumors were <0.5 cm3 at the endpoint; B), IfngKO (n = 10, 6/10 tumors were <0.5 cm3 at the endpoint; C) mutant CD4+ T cells compared to TslprKO CD4+ T cells (n = 8, 3/8 tumors were <0.5 cm3; n = 5, 0/5 tumors were <0.5 cm3; and n = 8, 2/8 tumors were <0.5 cm3 at the endpoint, respectively; two-way ANOVA). (D and E) Spider plots of primary PyMtOvatg TslprKO tumor growth in Tslptg TslprKO mice injected with Il3KO (n = 6, 4/6 tumors were <0.5 cm3 at the endpoint) versus TslprKO (n = 7, 2/7 tumors were <0.5 cm3 at the endpoint) CD4+ T cells (two-way ANOVA; D) and WT (n = 9, 6/9 tumors were <0.5 cm3 at the endpoint) versus TslprKO (n = 8, 1/8 tumors were <0.5 cm3 at the endpoint) CD4+ T cells (E) while both groups were treated with anti–IL-5 plus anti–GM-CSF blocking antibodies (ab; two-way ANOVA). (F) Spider plot of PyMtOvatg TslprKO primary tumor growth in Tslptg TslprKO mice injected with Il3KO CD4+ T cells in combination with anti–IL-5/GM-CSF antibodies (n = 13, 1/13 tumors were <0.5 cm3 at the endpoint) versus TslprKO CD4+ T cells and rat IgG isotype control antibody (n = 14, 1/14 tumors were <0.5 cm3 at the endpoint; two-way ANOVA). (G) Schematic diagram of the experimental paradigm used to elucidate the role of IL-3/IL-5/GM-CSF receptors on breast cancer cells in mediating the antitumor effects of TSLP-stimulated CD4+ T cells against breast cancer. (H) Spider plot of PyMtOvatg Csf2rbKO Csf2rb2KO primary tumor growth in Tslptg TslprKO mice injected with WT (n = 7, 1/7 tumors were <0.5 cm3 at the endpoint) versus TslprKO CD4+ T cells (n = 7, 1/7 tumors were <0.5 cm3 at the endpoint, two-way ANOVA). (I) PyMtOvatg Csf2rbKO Csf2rb2KO tumor weights at the endpoint in Tslptg TslprKO mice injected with WT (n = 7) versus TslprKO (n = 7) CD4+ T cells (Mann-Whitney U test). (J) Percentage survival of Tslptg TslprKO mice injected with WT (n = 7) versus TslprKO (n = 7) CD4+ T cells followed by PyMtOvatg Csf2rbKO Csf2rb2KO primary tumor implantation (log-rank test). (K) Distribution of histological grades of PyMtOvatg Csf2rbKO Csf2rb2KO primary tumors developed in Tslptg TslprKO mice injected with WT (n = 7) versus TslprKO (n = 7) CD4+ T cells (Fisher’s exact test). (L) Representative images of H&E-stained PyMtOvatg Csf2rbKO Csf2rb2KO breast tumors from Tslptg TslprKO mouse injected with WT CD4+ T cells, Tslptg TslprKO mouse injected with TslprKO CD4+ T cells, and the donor tumor from PyMtOvatg Csf2rbKO Csf2rb2KO mouse (scale bar: 100 μm). (M) Representative flow plots of transcription factor expression in PyMtOvatg Csf2rbKO Csf2rb2KO breast tumor–infiltrating CD4+ T cells isolated from Tslptg TslprKO mice injected with CD45.1+ WT versus TSLPRKO CD4+ T cells. Numbers on the plots represent the percentage of cells within each gate. (N) Percentage of GATA3+ Th2 cells among CD45.1+ WT CD4+ T cells (test, n = 6) versus TslprKO CD4+ T cells (control, n = 6) isolated from PyMtOvatg Csf2rbKO Csf2rb2KO breast tumors in Tslptg TslprKO mice (Mann–Whitney U test). Bar graph shows mean + SD. Each of the tumors in the studies is from a separate mouse. All experimental data verified in at least two independent experiments. *, P < 0.05; **, P < 0.01; ***, P < 0.0001.

