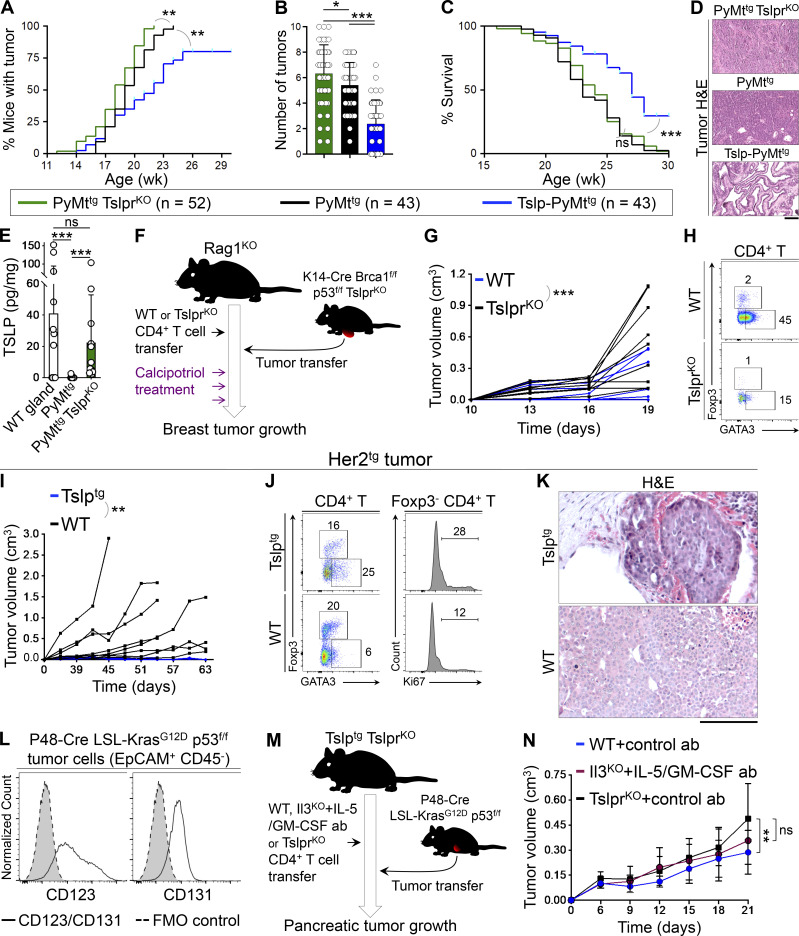
Figure 8.
Endogenous and induced TSLP activate Th2 immunity against primary cancer development. (A–C) PyMttg TslprKO, PyMttg, and Tslp-PyMttg mice on C57BL/6 background are compared for time to tumor onset (log-rank test; A), number of tumors per mouse (unpaired t test; B), and percentage survival (log-rank test; C). Bar graph shows mean + SD. (D) Representative images of H&E-stained PyMttg TslprKO, PyMttg, and Tslp-PyMttg. Note the glandular (i.e., differentiated) nature of the breast tumor in Tslp-PyMttg group (scale bar: 100 μm). (E) TSLP protein levels per mg of total tissue protein measured with ELISA in WT mammary glands (n = 12), PyMttg breast tumor (n = 12), and Tslp-PyMttg breast tumor (n = 12, Mann–Whitney U test). Bar graph shows mean + SD. (F) Schematic diagram of the experimental paradigm used to examine the impact of topical calcipotriol-induced CD4+ T cell immunity against Brca1-defcient primary breast tumors. (G) Spider plot showing K14-Cre Brca1f/f p53f/f TslprKO breast tumor growth in Rag1KO mice injected with WT (test, n = 9, 9/9 tumors were <0.5 cm3 at the endpoint) versus TslprKO (control, n = 9, 4/9 tumors were <0.5 cm3 at the endpoint) CD4+ T cells (two-way ANOVA). (H) Representative flow plots of transcriptional factor expression in the tumor-infiltrating CD4+ T cells isolated from Rag1KO mice injected with WT versus TSLPRKO CD4+ T cells. Numbers on the plots represent the percentage cells within each gate. (I) Spider plot of Her2tg primary breast tumor growth in Tslptg (n = 6, 6/6 tumors were <0.5 cm3) versus WT (n = 8, 3/8 tumors were <0.5 cm3 at the endpoint) mice (two-way ANOVA). (J) Representative flow plots of transcription factor expression in the Her2tg tumor-infiltrating CD4+ T cells isolated from Tslptg and WT mice. Histograms showing percentage Ki67+ Foxp3− CD4+ T effector cells isolated from Tslptg and WT mice. Numbers on the plots represent the percentage of cells within each gate. (K) Representative images of H&E-stained Her2tg breast tumors developed in Tslptg versus WT mice (scale bar: 100 μm). (L) Histogram showing expression levels of mouse IL-3Rα (CD123) and the common β chain receptor (CD131) on the surface of EpCAM+ CD45− P48-Cre LSL-KrasG12D p53f/f pancreatic tumor cells. Gray histograms with dashed outline show FMO control. (M) Schematic diagram of the experimental paradigm used to elucidate the effect of WT CD4+ T cells and the impact of IL-3/IL-5/GM-CSF blockade on pancreatic tumor growth in response to TSLP induction. Note that the transferred WT CD4+ T cells express CD45.1. (N) Graph of P48-Cre LSL-KrasG12D p53f/f primary tumor growth in Tslptg TslprKO mice injected with WT (n = 8), Il3KO (n = 7), or TslprKO (n = 8) CD4+ T cells. Mice that received Il3KO CD4+ T cells were treated with IL-5 and GM-CSF blocking antibodies, while mice that received WT and TslprKO CD4+ T cells were treated with control antibody (two-way ANOVA). Each of the tumors in the studies is from a separate mouse. All experimental data verified in at least two independent experiments. *, P < 0.05; **, P < 0.01; ***, P < 0.0001.

