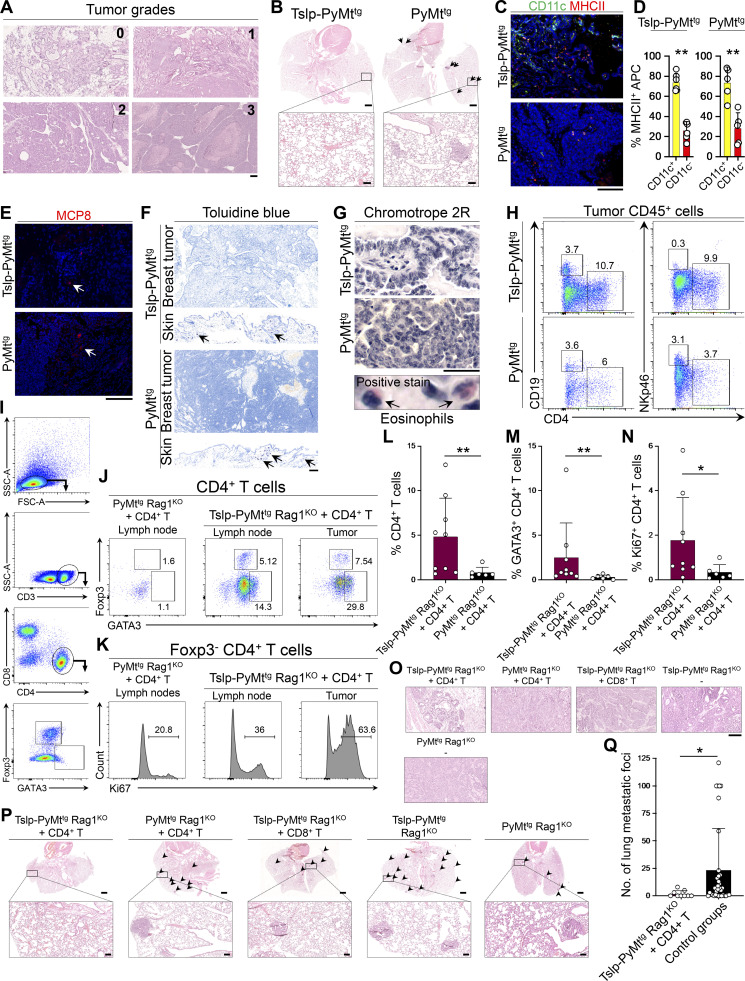
Figure S1.
TSLP induces CD4+ T cell immunity against spontaneous breast carcinogenesis. (A) Representative images of H&E-stained mouse spontaneous breast tumors depicting tumor grades used in the study (scale bar: 100 μm). (B) Representative low (scale bars: 1 mm) and high (insets, scale bars: 100 μm) magnification images of H&E-stained lungs of Tslp-PyMttg and PyMttg mice. Arrows point to breast cancer metastatic foci in PyMttg lung. (C) Representative images of CD11c/MHCII immunofluorescence staining in Tslp-PyMttg and PyMttg breast tumors (scale bar: 100 μm). (D) Percentage CD11c+ MHCII+ versus CD11c− MHCII+ APCs in Tslp-PyMTtg (n = 6) and PyMTtg (n = 5) breast tumors (Mann–Whitney U test). (E) Representative images of MCP8 immunofluorescence staining for basophils in Tslp-PyMttg and PyMttg tumors. Arrows highlight rare basophils in tumors (scale bar: 100 μm). (F) Representative images of toluidine blue staining for mast cells in Tslp-PyMttg and PyMttg breast tumors. Skin tissues from the same mice are included to show examples of positive staining for mast cells (arrows; scale bar: 100 μm). (G) Representative images of chromotrope 2R staining for eosinophil detection in Tslp-PyMttg and PyMttg breast tumors (scale bar: 100 μm). Positive stained eosinophils (arrows) in Tslp-PyMttg skin are highlighted with arrows in the lower panel. (H) Representative flow plots showing percentage CD19+ B cells and Nkp46+ NK cells among Tslp-PyMttg and PyMttg tumor-infiltrating CD45+ leukocytes. (I) Representative flow plots demonstrating the gating strategy used to assess GATA3+ CD4+ T cells in mice tissues. FSC, forward scatter; SSC, side scatter. (J and K) Representative flow cytometry dot plots (J) showing percentage GATA3 and Foxp3 positive cells (gated on CD3+CD4+ cells) in PyMttg Rag1KO + CD4+ T cell lymph nodes versus Tslp-PyMttg Rag1KO + CD4+ T cell lymph nodes and breast tumor and histograms (K) showing percentage Ki67+ cells among Foxp3− CD4+ T effector cells in the two groups. Numbers on the plots highlight the percentage of cells within each gate. (L–N) Percentage CD4+ T (L), GATA3+ Th2 (M), and Ki67+ CD4+ (N) T cells in Tslp-PyMttg Rag1KO +CD4+ T cell (test, n = 9) versus PyMttg Rag1KO + CD4+ T cell (control, n = 6) breast tumors. Note that the quantifications were performed in 10 HPF images per tumor sample stained with the respective markers. Each dot represents a tumor sample (Mann–Whitney U test). (O) Representative images of H&E-stained breast tumors from Tslp-PyMttg Rag1KO + CD4+, PyMttg Rag1KO + CD4+, Tslp-PyMttg Rag1KO + CD8+, Tslp-PyMttg Rag1KO, and PyMttg Rag1KO T cell groups (scale bar: 100 μm). (P) Representative low (scale bars: 1 mm) and high (inset, scale bars: 100 μm) magnification of H&E-stained lungs from Tslp-PyMttg Rag1KO + CD4+ T cell, PyMttg Rag1KO + CD4+ T cell, Tslp-PyMttg Rag1KO + CD8+ T cell, Tslp-PyMttg Rag1KO, and PyMttg Rag1KO mice. Arrowheads point to the breast cancer metastatic foci in the lungs. (Q) The number of breast cancer metastatic foci in the lungs of Tslp-PyMttg Rag1KO + CD4+ T cell mice (test, n = 9) compared with other groups combined (control groups, n = 35, Mann–Whitney U test). Bar graphs show mean + SD. All experimental data verified in at least two independent experiments. *, P < 0.05; **, P < 0.01.

