Figure S2.
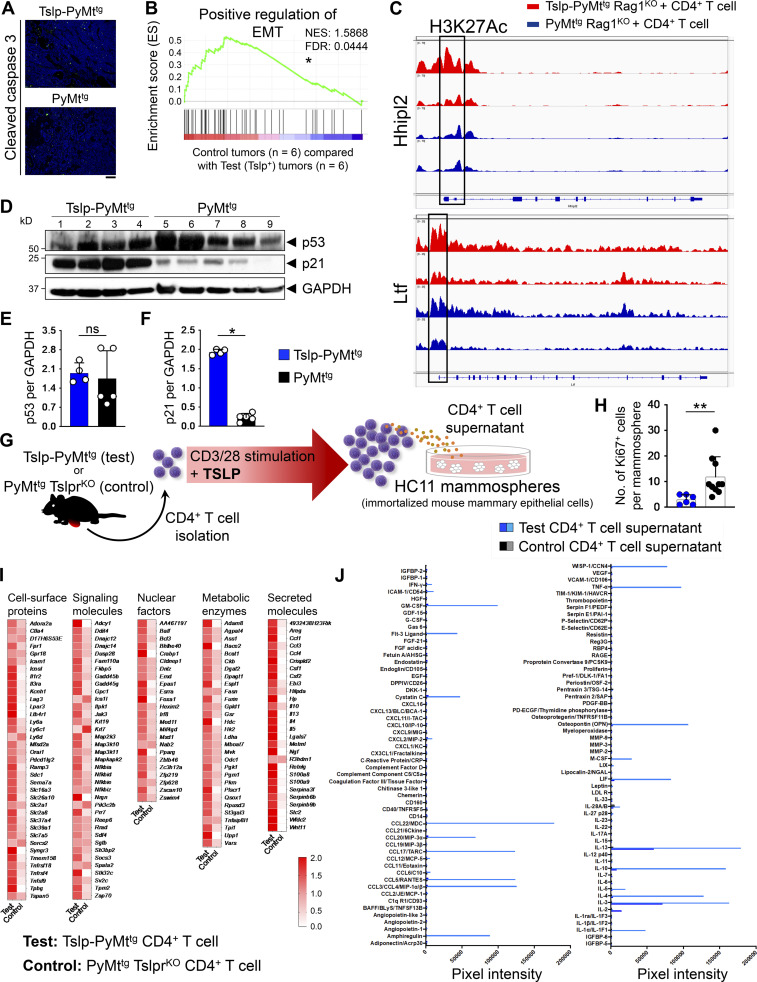
CD4+ T cell immunity suppresses EMT and induces breast cancer differentiation. (A) Representative immunofluorescence staining images of the apoptosis marker cleaved caspase 3 in Tslp-PyMttg and PyMttg breast tumors (scale bar: 100 μm). (B) The gene set enrichment analysis plot of positive regulation of EMT genes in PyMttg Rag1KO + CD4+ T cell and PyMttg (control, n = 6) compared with Tslp overexpressing Tslp-PyMttg Rag1KO + CD4+ T cell and Tslp-PyMttg breast tumors (test, n = 6) from RNA-sequencing data. NES, normalized enrichment score. (C) Peaks of H3K27 acetylation in the promoter region, highlighted by black boxes, of mammary gland differentiation genes that were upregulated in Tslp-PyMttg Rag1KO + CD4+ T cell (test, red tracks) compared with PyMttg Rag1KO + CD4+ T cell (control, blue tracks) breast tumors. (D) Western blot for p53 and p21 on tumor lysates from Tslp-PyMttg and PyMttg primary tumors. GAPDH is used as the control housekeeping protein. (E and F) Quantification of p53 (E) and p21 (F) protein bands in Tslp-PyMttg (test, n = 4) compared with PyMttg (control, n = 5) tumors (Mann–Whitney U test). (G) Schematic diagram of the experimental procedure for CD4+ T cell isolation, ex vivo stimulation, and HC11 mammosphere culture. (H) The number of Ki67+ cells per HC11 mammosphere exposed to supernatants derived from Tslp-PyMttg CD4+ T cells (test CD4+ T cell sup., n = 6) versus PyMttg TslprKO CD4+ T cells (control CD4+ T cell sup., n = 10, Mann–Whitney U test). (I) The transcriptome of CD4+ T cells isolated from Tslp-PyMttg mice (test, n = 3) compared with CD4+ T cells isolated from PyMttg TslprKO (control, n = 3) mice. The heatmap demonstrates the ratio between mean fragments per kilobase of transcript per million mapped reads (FPKM) value of each group and the average of mean FPKM values of the two groups. (J) Measurements of signal intensity of the cytokines, chemokines, and growth factors represented on the protein arrays performed on test (Tslp-PyMttg) and control (PyMttg TslprKO) CD4+ T cells supernatants related to arrays shown in Fig. 3 E. Bar graph shows mean + SD. All experimental data verified in at least two independent experiments. *, P < 0.05; **, P < 0.01.

