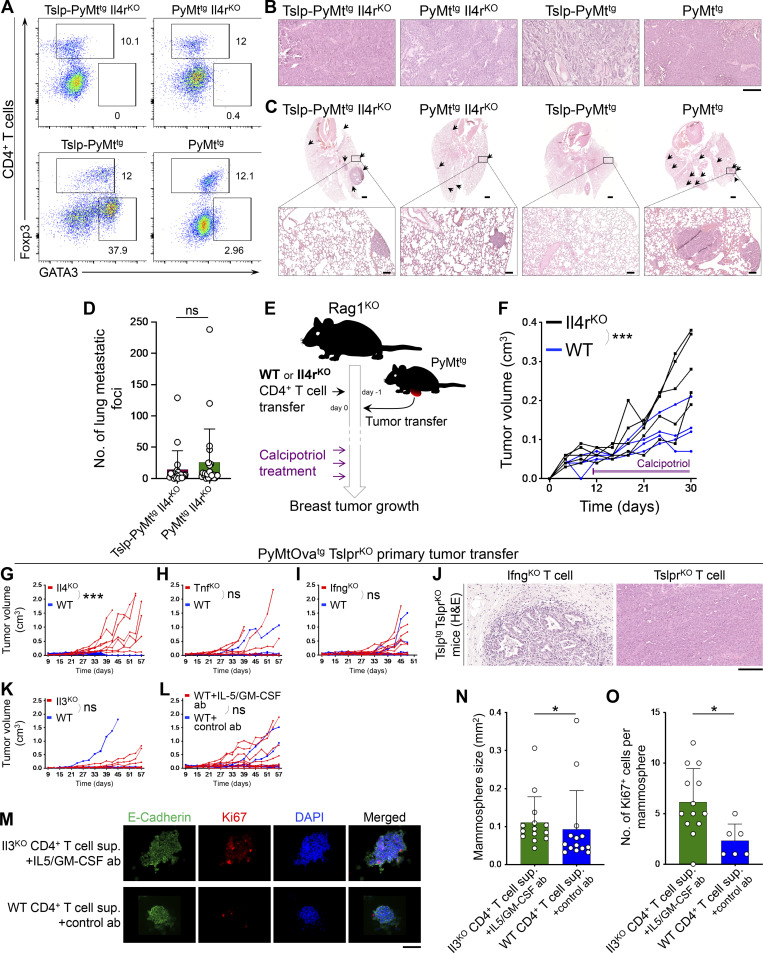
Figure S3.
Th2 polarization and cytokine release play critical roles in TSLP-stimulated CD4+ T cell immunity against breast cancer. (A) Representative flow plots of transcriptional factor expression in tumor-infiltrating CD4+ T cells in Tslp-PyMttg Il4rKO, PyMttg Il4rKO, Tslp-PyMttg, and PyMttg mice. Numbers on the plots show the percentage of the cells within each gate. (B) Representative images of H&E-stained breast tumors in Tslp-PyMttg Il4rKO, PyMttg Il4rKO, Tslp-PyMttg, and PyMttg groups (scale bar: 100 μm). (C) Representative low (scale bars: 1 mm) and high (insets, scale bars: 100 μm) magnification images of H&E-stained lungs from Tslp-PyMttg Il4rKO, PyMttg Il4rKO, Tslp-PyMttg, and PyMttg mice. Breast cancer metastatic foci in each lung are highlighted by arrows. (D) The number of breast cancer metastatic foci in the lungs of Tslp-PyMttg Il4rKO (test, n = 20) compared with PyMttg Il4rKO mice (control, n = 23, Mann–Whitney U test). (E) Schematic diagram of the experimental paradigm used to elucidate the ability of IL4rαKO compared with WT CD4+ T cells to suppress breast tumor growth in Rag1KO mice in response to TSLP induction by topical calcipotriol treatment. Note that the calcipotriol treatment was started when implanted PyMttg tumors became palpable (∼5 mm in diameter) and repeated every 3 d until the conclusion of the study. Tumor/T cell donor and recipient mice are on the BALB/c background. (F) Spider plot of PyMttg primary tumor growth in Rag1KO mice injected with Il4rαKO (n = 5) versus WT (n = 4) CD4+ T cells and treated with calcipotriol (two-way ANOVA). The duration of calcipotriol treatment is indicated by purple bar on the graph. (G–I) Spider plots of PyMtOvatg TslprKO primary tumor growth in Tslptg TslprKO mice injected with Il4KO (n = 8, 2/8 tumors were <0.5 cm3 at the endpoint; G), TnfKO (n = 6, 2/6 tumors were <0.5 cm3 at the endpoint; H), IfngKO (n = 10, 6/10 tumors were <0.5 cm3 at the endpoint; I) mutant CD4+ T cells compared to WT CD4+ T cells (n = 6, 6/6 tumors were <0.5 cm3; n = 6, 5/6 tumors were <0.5 cm3; and n = 8, 6/8 tumors were <0.5 cm3 at the endpoint, respectively). Note that Il4KO, TnfKO, and IfngKO tumor growth data are also shown in Fig. 6, A–C (two-way ANOVA). (J) Representative images of H&E-stained PyMtOvatg TslprKO breast tumors in Tslptg TslprKO mice injected with IfngKO versus TslprKO CD4+ T cells (scale bar: 100 μm). (K and L) Spider plots of primary PyMtOvatg TslprKO tumor growth in Tslptg TslprKO mice injected with Il3KO (n = 6, 4/6 tumors were <0.5 cm3 at the endpoint) versus WT (n = 6, 5/6 tumors were <0.5 cm3 at the endpoint) CD4+ T cells (two-way ANOVA; K) and WT CD4+ T cells in combination with anti–IL-5 plus anti–GM-CSF blocking antibodies (ab, n = 9, 6/9 tumors were <0.5 cm3 at the endpoint) versus WT CD4+ T cells and Rat IgG isotype control antibody (n = 10, 8/10 tumors were <0.5 cm3 at the endpoint; L; two-way ANOVA). Note that Il3KO and WT CD4+ T cells plus anti–IL-5 plus anti–GM-CSF blocking antibodies tumor growth data are also shown in Fig. 6, D and E. (M) Representative images of HC11 mammosphere immunofluorescence staining after exposure to supernatants (sup.) derived from splenic Il3KO versus WT CD4+ T cells stimulated once with anti-CD3, anti-CD28, and TSLP for 3 d ex vivo. Before addition to HC11 mammosphere culture, Il3KO and WT CD4+ T cell supernatants were mixed with IL5/GM-CSF blocking and control antibodies, respectively. Mammospheres were stained for E-cadherin (green), Ki67 (red), and DAPI (blue, scale bar: 100 μm). (N) Quantification of HC11 mammosphere size in Il3KO CD4+ T cell supernatant plus IL-5/GM-CSF antibodies (n = 14) versus WT CD4+ T cell supernatant plus control antibody (n = 14) group. Each dot represents one mammosphere (Mann–Whitney U test). (O) The number of Ki67+ cells per HC11 mammosphere exposed to Il3KO CD4+ T cell supernatant plus IL-5/GM-CSF antibodies (n = 13) versus WT CD4+ T cell supernatant plus control antibody (n = 6). Each dot represents one mammosphere (Mann–Whitney U test). Bar graph shows mean + SD. All experimental data verified in at least two independent experiments. *, P < 0.05; ***, P < 0.0001.

