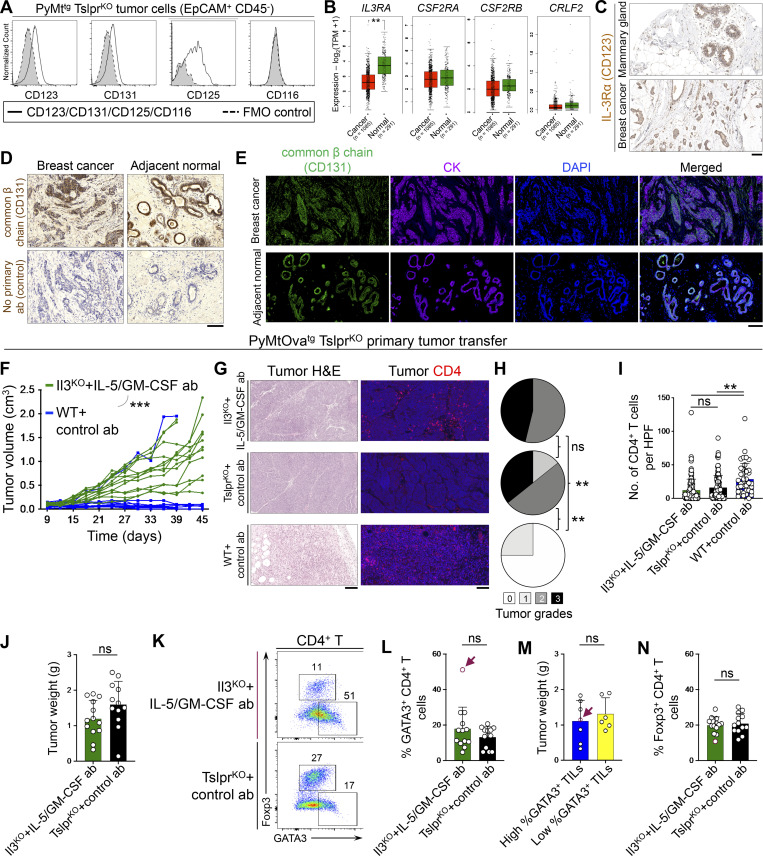
Figure S4.
IL-3, IL-5, and GM-CSF receptors expression and function in breast normal epithelial and cancer cells. (A) Histogram showing expression levels of mouse IL-3Rα (CD123), common β chain receptor (CD131), IL-5Rα (CD125), and GM-CSFRα (CD116) on the surface of EpCAM+ CD45− PyMttg tumor cells. Gray histograms with dashed outline show fluorescence minus one (FMO) control. (B) Box plots of human IL3RA (IL-3 receptor α chain), CSF2RA (GM-CSF receptor α chain), CSF2RB (common β chain receptor), and CRLF2 (TSLPR) gene expression in normal mammary glands versus breast cancer samples across TCGA/GTEx datasets (one-way ANOVA, Gene Expression Profiling Interactive Analysis database). (C) IL-3Rα immunohistochemical stain of human mammary gland and breast tumor. Images were obtained from the Human Protein Atlas website (https://v18.proteinatlas.org). (D) Representative images of common β chain receptor (CD131) IHC staining on human breast tumor and adjacent normal breast glands. Control staining with no primary antibody is also shown. (E) Representative images of common β chain receptor (CD131) and cytokeratin (CK) immunofluorescence staining on human breast tumor and adjacent normal breast glands. (F) Spider plot of PyMtOvatg TslprKO primary tumor growth in Tslptg TslprKO mice injected with Il3KO CD4+ T cells in combination with anti–IL-5/GM-CSF antibodies (n = 13, 1/13 tumors were <0.5 cm3 at the endpoint) versus WT CD4+ T cells and Rat IgG isotype control antibody (n = 10, 9/10 tumors were <0.5 cm3 at the endpoint; two-way ANOVA). Note that Il3KO CD4+ T cells plus anti–IL-5/GM-CSF antibodies tumor growth data are also shown in Fig. 6 F. (G) Representative H&E and CD4-immunostained images of PyMtOvatg TslprKO primary tumors developed in Tslptg TslprKO mice injected with Il3KO CD4+ T cells plus anti–IL-5 and anti–GM-CSF blocking antibodies (test) versus TslprKO CD4+ T cells plus isotype control antibody (negative control) and WT CD4+ T cells plus isotype control antibody (positive control). (H) Distribution of histological grades of PyMtOvatg TslprKO primary tumors developed in Tslptg TslprKO mice injected with Il3KO CD4+ T cells plus anti–IL-5 and anti–GM-CSF blocking antibodies (test, n = 13) versus TslprKO CD4+ T cells plus isotype control antibodies (negative control, n = 14) and WT CD4+ T cells plus isotype control antibodies (positive control, n = 4, Fisher’s exact test). (I) Quantification of CD4+ T cells in PyMtOvatg TslprKO primary tumors developed in Tslptg TslprKO mice injected with Il3KO CD4+ T cells plus anti–IL-5 and anti–GM-CSF blocking antibodies (test, n = 13) versus TslprKO CD4+ T cells plus isotype control antibody (negative control, n = 12) and WT CD4+ T cells plus isotype control antibody (positive control, n = 4). CD3/CD4 double-positive cells were counted in 10 HPF images per tumor sample. HPF images for each sample were chosen randomly across the tumor section. Each dot represents one HPF image (unpaired t test). (J) PyMtOvatg TslprKO tumor weight developed in Tslptg TslprKO mice injected with Il3KO CD4+ T cells plus anti–IL-5 and anti–GM-CSF blocking antibodies (n = 13) versus TslprKO CD4+ T cells plus isotype control antibody (n = 12). Note that WT CD4+ T cells plus isotype control antibody (positive control) were not included in this analysis, as only one of four tumors had an appreciable mass (Mann–Whitney U test). (K) Flow plot showing percentage GATA3+ Th2 and Foxp3+ regulatory T cells (Tregs) among tumor-infiltrating CD4+ T cells in Il3KO CD4+ T cells plus anti–IL-5 and anti–GM-CSF blocking antibodies versus TslprKO CD4+ T cells plus isotype control antibody group. (L) Percentage GATA3+ Th2 cells among tumor-infiltrating CD4+ T cells in Il3KO CD4+ T cells plus anti–IL-5 and anti–GM-CSF blocking antibodies (n = 13) versus TslprKO CD4+ T cells plus isotype control antibody (n = 13) group (Mann–Whitney U test). (M) Tumor weights compared between the tumors with high (n = 7) versus low (n = 6) percentage GATA3+ Th2 cells in Il3KO CD4+ T cells plus anti–IL-5 and anti–GM-CSF blocking antibodies (test) group. Red arrows point to the tumor with the highest percentage of tumor-infiltrating Th2 cells (Mann–Whitney U test). (N) Percentage Foxp3+ Tregs among tumor-infiltrating CD4+ T cells in Il3KO CD4+ T cells plus anti–IL-5 and anti–GM-CSF blocking antibodies (n = 13) versus TslprKO CD4+ T cells plus isotype control antibody (n = 13) group (Mann–Whitney U test). Scale bars 100 μm. Bar graph shows mean + SD. All experimental data verified in at least two independent experiments. **, P < 0.01; ***, P < 0.0001.

