Figure S5.
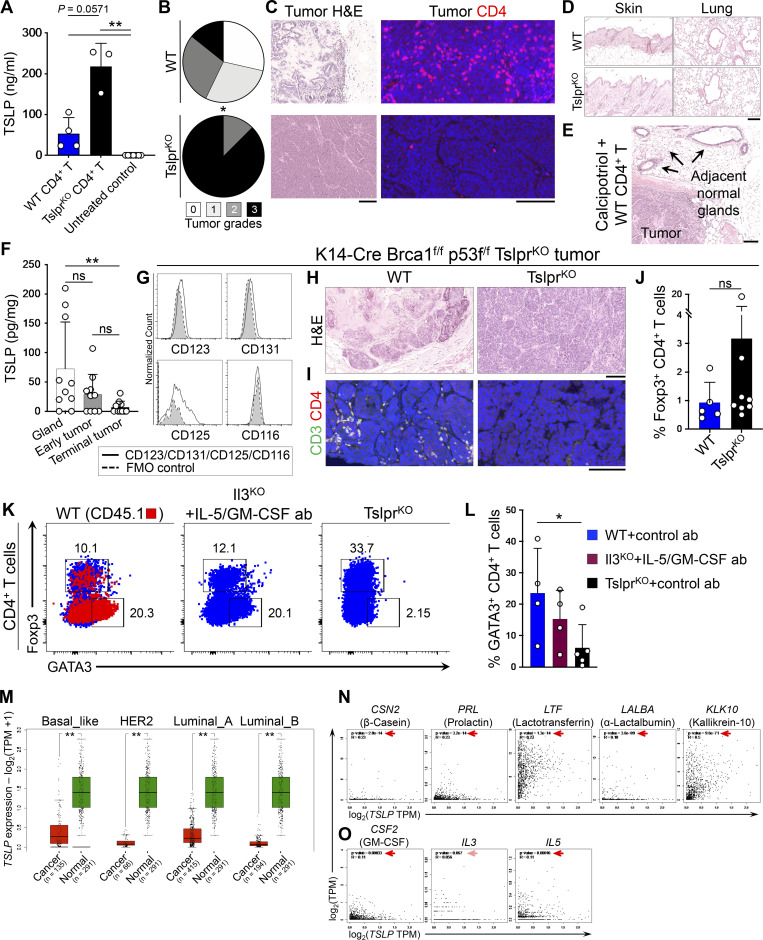
Topical TSLP induction and Th2 cell immunity against mouse and human breast cancer. (A) TSLP protein levels measured with ELISA in plasma of TslprKO mice transferred with PyMtOvatg TslprKO primary tumors and WT CD4+ T cells (n = 4) or TslprKO CD4+ T cells (n = 3) 24 h after topical calcipotriol application. Plasma from untreated WT mice (n = 7) was used as controls (bar graph shows mean + SD, Mann–Whitney U test). (B) Distribution of histological grades of PyMtOvatg TslprKO primary tumors developed in TslprKO mice injected with WT (n = 7) versus TslprKO (n = 8) CD4+ T cells and treated with topical calcipotriol (Fisher’s exact test). (C) Representative H&E and CD4-immunostained images of PyMtOvatg TslprKO primary tumors developed in TslprKO mice treated with calcipotriol and injected with WT or TslprKO CD4+ T cells. (D) Representative images of H&E-stained skin and lung tissue from TslprKO mice injected with WT or TslprKO CD4+ T cells and implanted with PyMtOvatg TslprKO after topical calcipotriol treatment. Note the absence of inflammation in the normal barrier organs of the mice. (E) Representative images of H&E-stained breast tumor and adjacent mammary glands of TslprKO mice treated with topical calcipotriol after receiving WT CD4+ T cells and PyMtOvatg TslprKO primary tumor transfer. Note the absence of inflammation around the normal mammary glands of the mouse. (F) TSLP protein levels in tissue lysates from WT breast glands, early breast tumors (postnatal day 60–90), and terminal breast cancers from PyMttg mice on the BALB/c background (Mann–Whitney U test). (G) Histogram showing expression levels of mouse IL-3Rα (CD123), common β chain receptor (CD131), IL-5Rα (CD125), and GM-CSFRα (CD116) on the surface of EpCAM+ CD45− K14-Cre Brca1f/f p53f/f TslprKO tumor cells. Gray histograms with dashed outline show FMO control. (H and I) Representative images of H&E-stained (H) and CD3/CD4-stained (I) K14-Cre Brca1f/f p53f/f TslprKO tumors developed in Rag1KO mice injected with WT or TslprKO CD4+ T cells and treated with topical calcipotriol. (J) Percentage Foxp3+ Tregs among WT CD4+ T cells (test, n = 5) versus TslprKO CD4+ T cells (control, n = 8) isolated from K14-Cre Brca1f/f p53f/f TslprKO breast tumors grown in Rag1KO mice (Mann–Whitney U test). (K) Representative flow plots of transcriptional factor expression in CD4+ T cells isolated from P48-Cre LSL-KrasG12D p53f/f pancreatic tumor from Tslptg TslprKO mice injected with CD45.1+ WT, Il3KO plus IL-5/GM-CSF antibodies or TSLPRKO CD4+ T cells. Numbers on the plots represent the percentage of cells within each gate. (L) Percentage GATA3+ Th2 cells among CD45.1+ WT CD4+ T cells (n = 4), Il3KO plus IL-5/GM-CSF antibodies (n = 4), and TslprKO CD4+ T cells (n = 5) isolated from P48-Cre LSL-KrasG12D p53f/f pancreatic tumors (Mann–Whitney U test). (M) Box plots of TSLP expression in normal mammary glands versus different breast cancer subtypes across TCGA/GTEx datasets (one-way ANOVA, Gene Expression Profiling Interactive Analysis database). (N) Correlation between TSLP and differentiation genes expression in breast cancers in TCGA. Note that CSN2 (β-casein), PRL (prolactin), LTF (Lactotransferrin), LALBA (α-lactalbumin), and KLK10 (kallikrein-10) are breast gland differentiation genes that were found to be most upregulated in Tslp overexpressing PyMttg tumors. (O) Correlation between TSLP and CSF2/IL3/IL5 in breast cancers in TCGA. Significant correlations are highlighted by red arrows (Spearman’s rank correlation, Gene Expression Profiling Interactive Analysis database). Scale bars 100 μm. Bar graph shows mean + SD. All murine experimental data verified in at least two independent experiments. *, P < 0.05; **, P < 0.01.

