FIGURE 3.

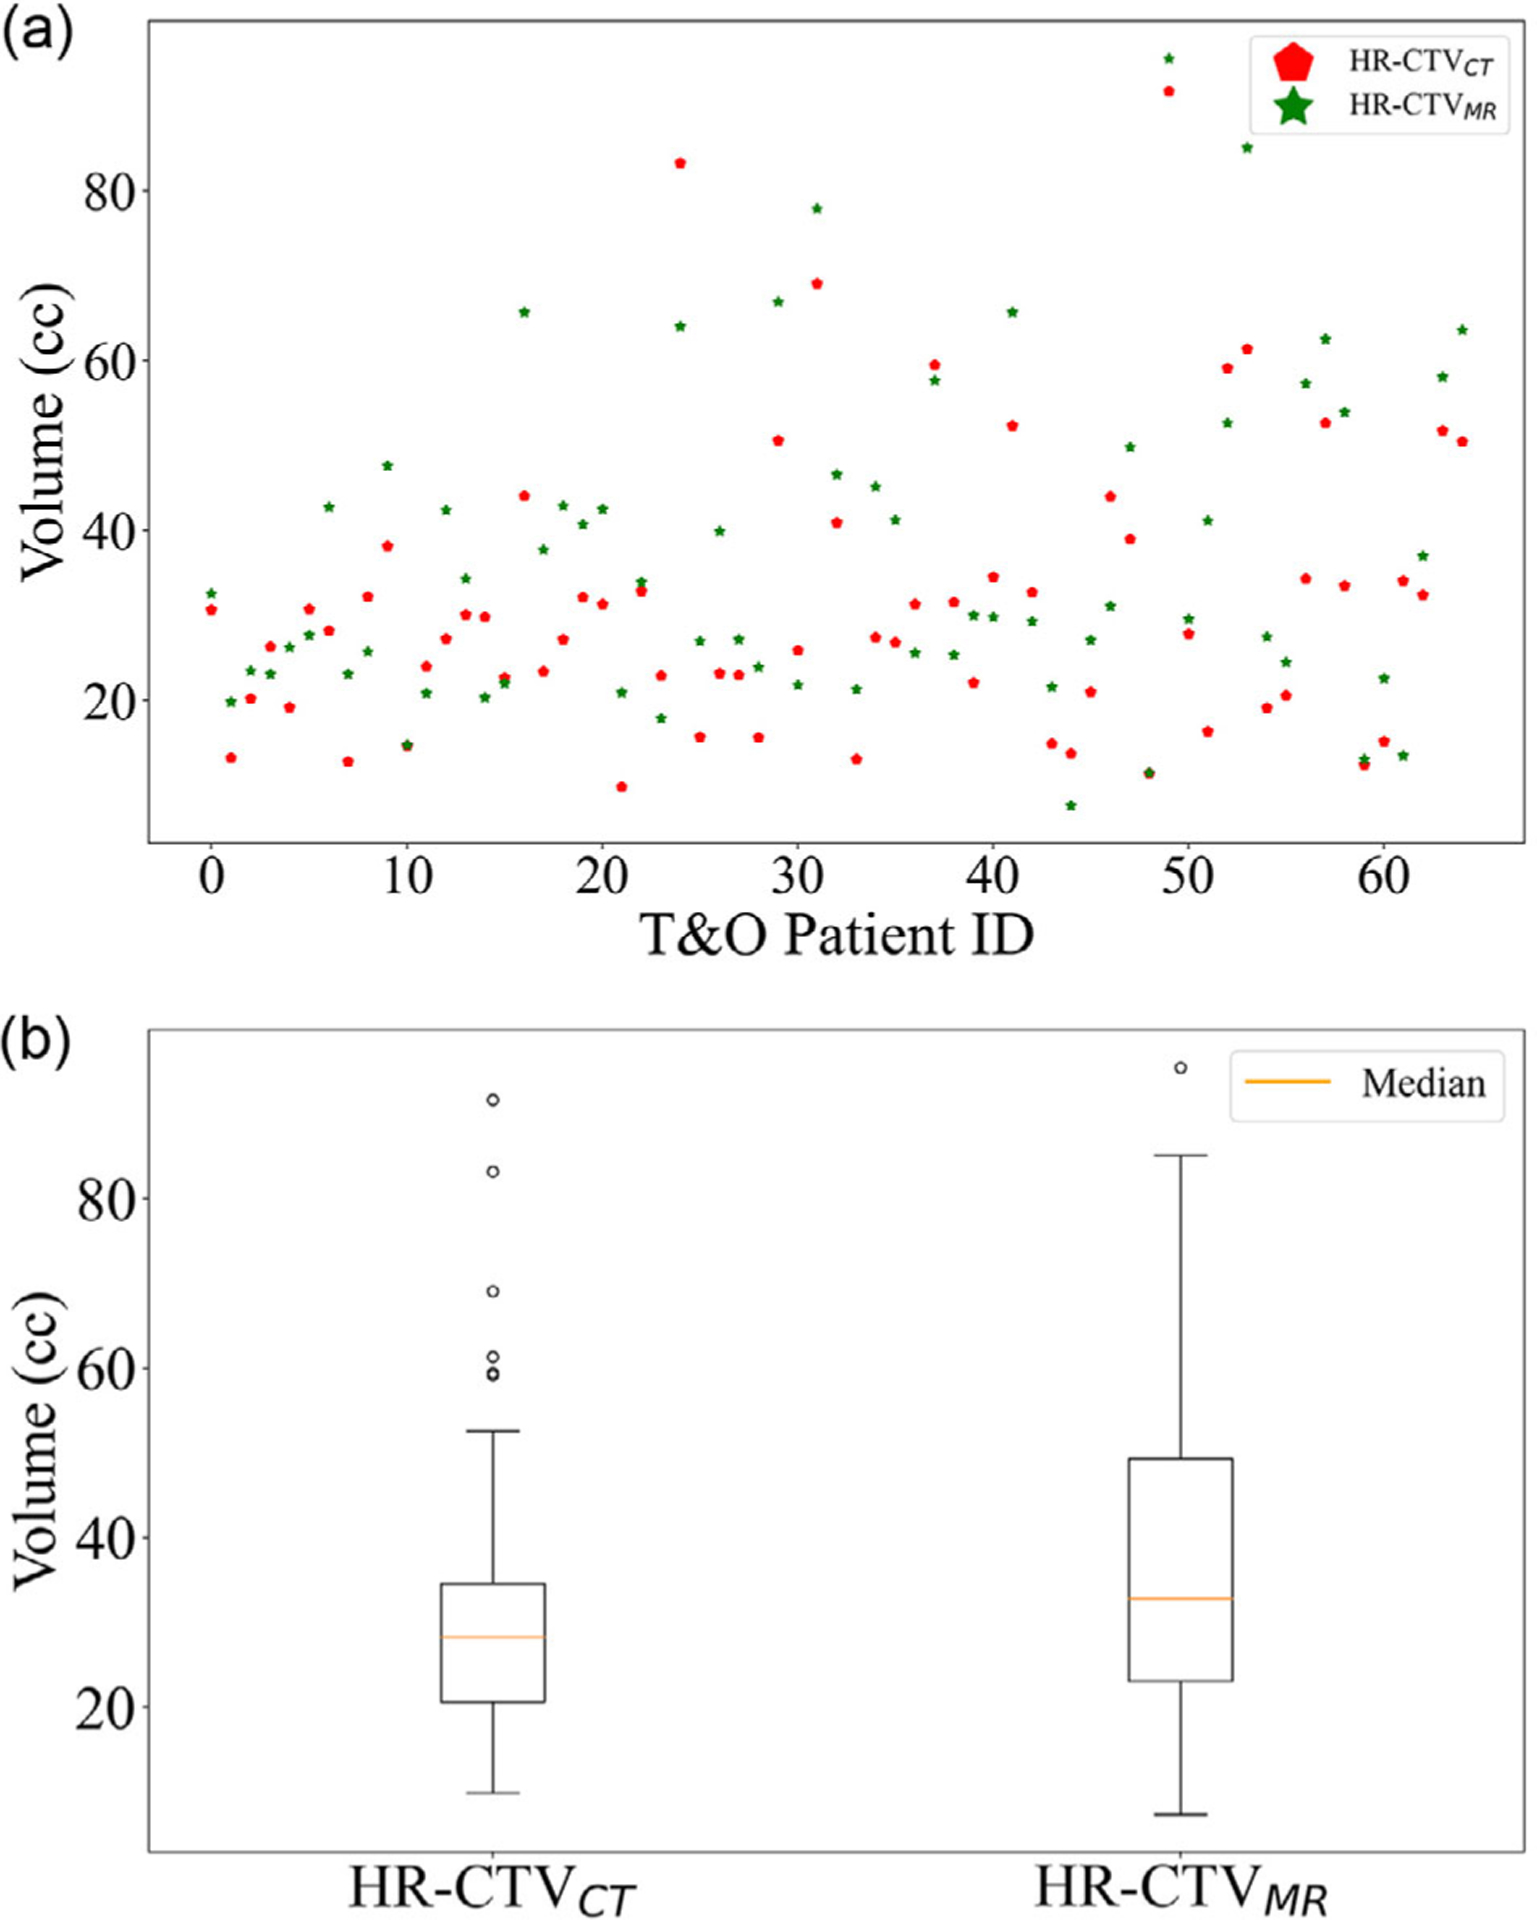
(a) The volume distribution of high-risk clinical target volume (HR-CTVCT) and HR-CTVMR. (b) Boxplots of HR-CTVCT in computed tomography (CT) and HR-CTVMR in MR. The difference in volumes is not statistically significant (p = 0.06)

(a) The volume distribution of high-risk clinical target volume (HR-CTVCT) and HR-CTVMR. (b) Boxplots of HR-CTVCT in computed tomography (CT) and HR-CTVMR in MR. The difference in volumes is not statistically significant (p = 0.06)