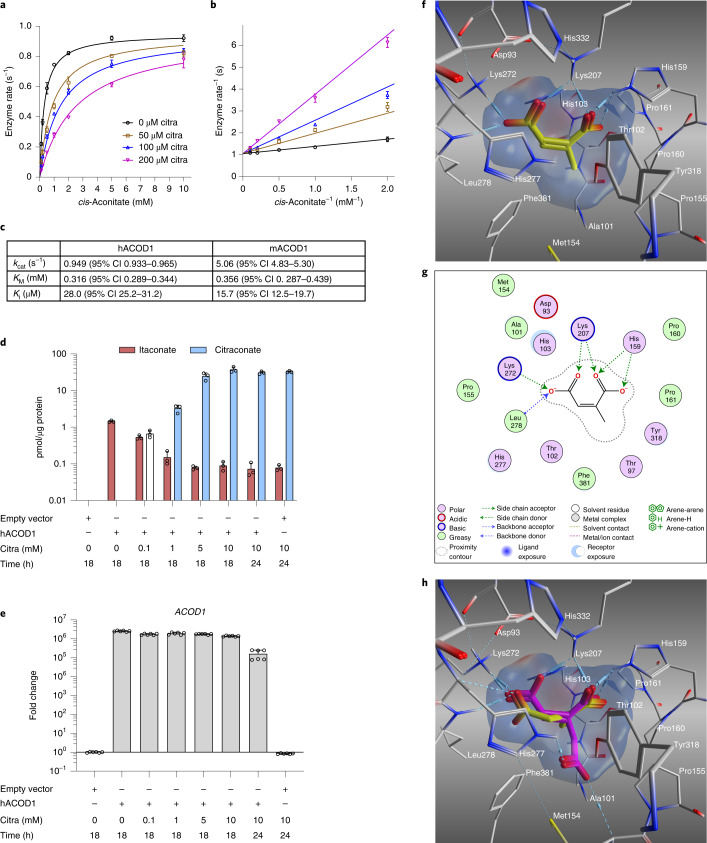
Fig. 3. Citraconate is a competitive inhibitor of ACOD1 that binds in the substrate-binding site.
a–c, Cell-free assay. Recombinant hACOD1 was incubated with increasing concentrations of substrate (cis-aconitate) and inhibitor (citraconate) and itaconate accumulation was measured by HPLC. n = 3 independent assays, mean ± s.d. The line represents a curve fit to the Michaelis–Menten equation with a competitive inhibitor. b, Lineweaver–Burk plot of the data shown in a (mean ± s.d.). c, Summary of enzyme and inhibition kinetics based on a (hACOD1) and data shown in Extended Data Fig. 7a,b (mACOD1). d,e, Cell-based assay. A549 cells were transfected with a plasmid overexpressing hACOD1 and incubated with increasing concentrations of citraconate. Intracellular citraconate and itaconate concentrations were measured by HPLC–MS/MS. Adding citraconate leads to reduced itaconate accumulation in a dose-dependent manner (d), which is not due to decreased hACOD1 transcription (e). n = 3 biological replicates (d), n = 6 biological replicates (e), mean ± s.d. f–g, Putative binding mode of citraconate (yellow) in the active site of hACOD1 (PDB ID: 6R6U)2. f, The C1- and C4-carboxyl groups of citraconate are optimally anchored in the active site through a network of electrostatic attractions; that is, hydrogen bonds and salt bridges (dashed lines) with the residues His159, Lys207, Lys272 and Leu278. Electrostatic protein surface at the active site: positive (blue), negative (red) and neutral (white). g, Two-dimensional ligand interactions. h, Molecular modelling of itaconate (yellow) compared with cis-aconitate (magenta) revealing fewer interactions between the two carboxyl groups of itaconate and the basic residues of the hACOD1 active site mainly due to its non-planar and flexible structure. CI, confidence intervals; citra, citraconate.

