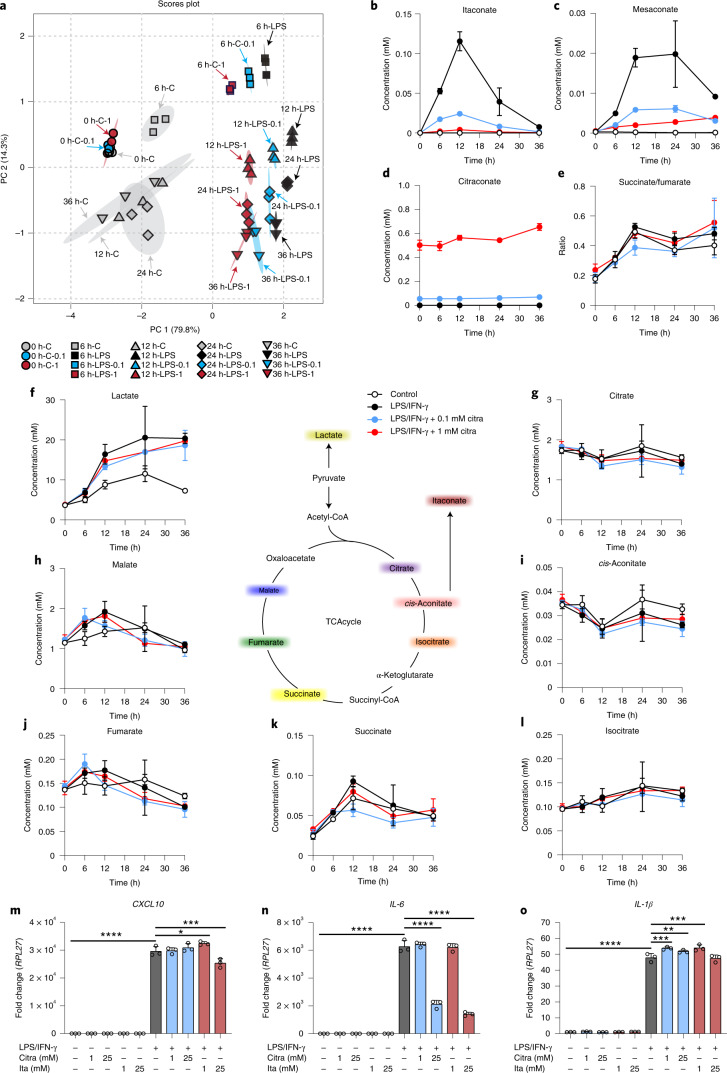
Fig. 4. Citraconate prevents itaconate and mesaconate accumulation in LPS/IFN-γ-mediated macrophage activation.
dTHP1 cells were stimulated with LPS (200 ng ml−1) and IFN-γ (400 U ml−1) for the indicated times in the absence or presence of 0.1, 1, 5, 10 and 25 mM citraconate. Unstimulated dTHP1 cells treated for 6 h were used as an additional control. Itaconate isomers, lactate and the same TCA intermediates as in Fig. 1 were measured by LC–MS/MS. Concentrations 0.1 and 1 mM citraconate in medium resulted in strong ACOD1 inhibition at physiologically plausible intracellular citraconate concentrations and were thus used for the analyses shown in a–l. Data obtained with the 5–25 mM concentrations were additionally used to calculate IC50 values. a, PCA based on all analytes except citraconate. b–e, Time course of itaconate (b), mesaconate (c), citraconate (d) concentrations and succinate/fumarate ratio (e). f–l, Concentrations of lactate and selected TCA intermediates. m–o, ACOD1 inhibition by citraconate does not have a strong effect on inflammation in dTHP1 cells activated by LPS-IFN-γ. Experimental set-up identical to a–l. Levels of the indicated mRNAs were measured by RT–qPCR 12 h after stimulation. m, CXCL10 mRNA. n, IL-6 mRNA. o, IL-1β mRNA. Citra, citraconic acid; ita, itaconic acid. b–o, n = 3 biological replicates, mean ± s.d. *P ≤ 0.05, **P ≤ 0.01, ***P ≤ 0.001, ****P ≤ 0.0001; one-way ANOVA with Dunnett’s multiple comparisons test.

