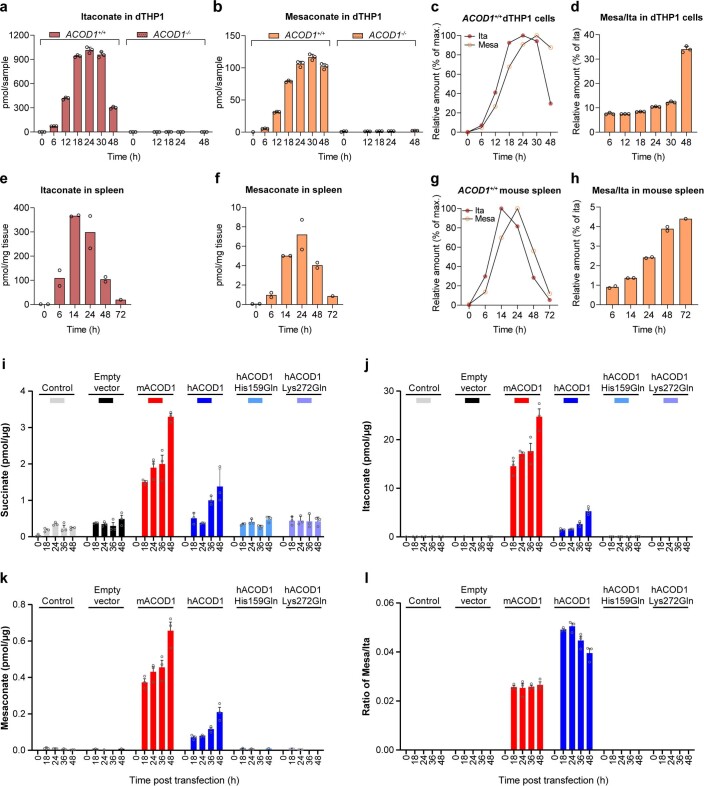
Extended Data Fig. 2. Dependence of mesaconate accumulation on itaconate synthesis.
a–h, Mesaconate accumulation peaks after itaconate accumulation in LPS-induced inflammation and depends on prior itaconate synthesis in dTHP1 cells. a–d, dTHP1 cells were stimulated with LPS/IFNγ and intracellular concentrations of the three isomers were measured by HPLC-MS/MS at the indicated time points. Citraconate was not detected. Neither itaconate nor mesaconate were detected in ACOD1–/– dTHP1 cells. The maximal itaconate concentration at 24 h was 460 µmol/L. n=3 biological replicates, means ±SD. e–h, Systemic inflammation was elicited in C57BL/6N mice by intraperitoneal LPS injection, and concentrations of the three isomers in spleen homogenates were measured by HPLC-MS/MS at the indicated time points. n=2 mice per time point. i–l, Mesaconate accumulation in A549 cells overexpressing ACOD1. Human or murine ACOD1 was expressed in A549 cells by transient transfection, and concentrations of the three isomers as well as selected TCA intermediates and lactate were measured by HPLC-MS/MS at the indicated time points. Values <LLOQ were considered missing values. Transfection of both enzymes resulted in a parallel rise of itaconate and mesaconate concentrations, whereas citraconate was not detected. mACOD1 expression led to a greater increase in succinate levels, consistent with greater SDH inhibition due to higher itaconate synthesis when compared to hACOD1. His159Gln and Lys272Gln are inactive hACOD1 variants1. Concentrations are expressed per µg protein. n=3 biological replicates, mean ±SD.

