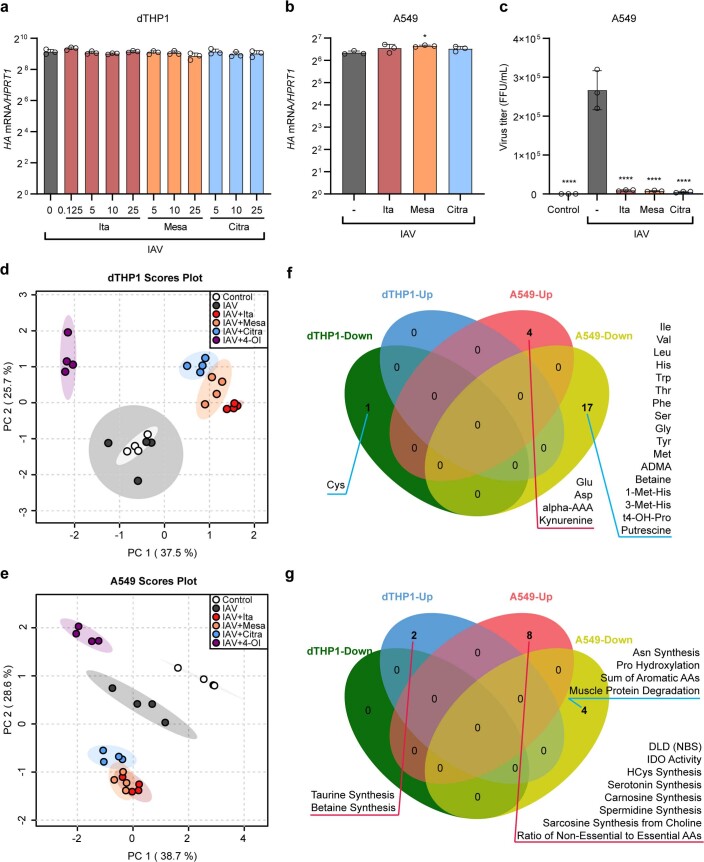
Extended Data Fig. 5. The itaconate isomers inhibit replication of influenza A virus (IAV) in the respiratory epithelial cell line A549.
dTHP1 and A549 cells were left untreated or incubated with itaconate, mesaconate or citraconate (20 mM) or 4-octyl itaconate (4-OI, 125 µM), infected with IAV PR8M (MOI=1), and then incubated with fresh medium containing the treatments. Replication was measured in dTHP1 cells 12 h p.i. by expression of HA mRNA (RT-qPCR) and in A549 cells 24 h p.i. by measuring HA mRNA (RT-qPCR) and viral titers (foci forming assay). a, HA mRNA (dTHP1 cells). b, HA mRNA (A549 cells). c, IAV titers (A549 cells). n=4 biological replicates, means ±SD. One-way ANOVA followed by Dunnett’s multiple comparisons test. P values: * ≤0.05, ** ≤0.01, *** ≤0.001, **** ≤0.0001. Shared and unique effects of the itaconate isomers on amino acid metabolism in IAV infected dTHP1 and A549 cells. d-g, Same experimental set-up as a-c, except that 4-OI (125 µM) was used as additional treatment. Concentrations of 20 amino acids, 30 amino acid metabolites, and 9 biogenic amines were measured by HPLC-MS/MS (MxP Quant 500 kit, Biocrates) after 12 h for dTHP1, 24 h for A549 (n=4 per group). Additional data, including concentrations of individual analytes and values of metabolite indicators, are shown in Supplementary Fig. S3 and S4. d,e, PCAs based on the 59 amino acid-related analytes. d, In dTHP1 cells, infection leads to modest changes only, while the three isomers exert similar but clearly discernable effects, which differ profoundly from the impact of 4-OI. e, In A549 cells, infection exerts a much stronger impact on amino acid metabolism. f, Venn diagrams showing analytes that are differentially abundant (unpaired T-test, FC>1.3, FDR ≤0.05) in A549 and dTHP1 infected and uninfected cells. g, Venn diagrams for the metabolite indicators (66 sums and ratios of functionally related analytes, calculated with Biocrates MetaboIndicatorTM software). Source Data Table 1 contains the source data pertaining to d-g.

