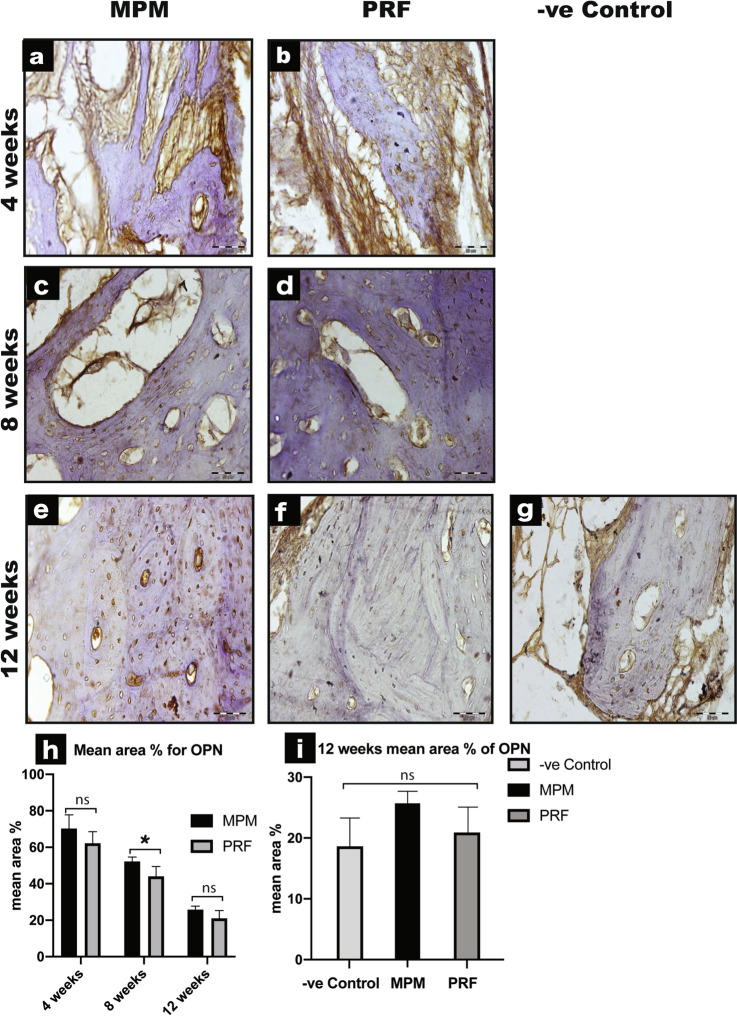
Fig. 6.
Immunohistochemical expression of OPN from treated dogs with MPM and PRF across all time intervals. a, b Photomicrographs showing changes in OPN immune-positivity at 4-weeks’ time point OPN with strong positive immune expression in the extracellular matrix in both MPM and PRF with no significant difference. c, d Decrease in OPN immune-staining is seen at 8-weeks in both MPM and PRF. e, f Further decrease in OPN staining is noted in both MPM and PRF treated groups at 12-weeks’ interval with linear deposition of OPN immunoreaction across the cement lines in MPM while, less homogeneously dispersed OPN immune positivity throughout the osteon was noted in the PRF group. g Photograph for the negative control group with reduced OPN immunoreaction seen only in the scanty bone marrow. h A representative graph showing the difference in mean area percentage of OPN immunoexpression between MPM and PRF across all study periods with a statistical significance at 8-weeks interval denote by an asterisk (P < 0.05). i A representative graph illustrating 12-weeks mean area percent for MPM, PRF and negative control groups showing almost the same results for all groups with no significant difference. (All sections are stained with OPN × 400)

