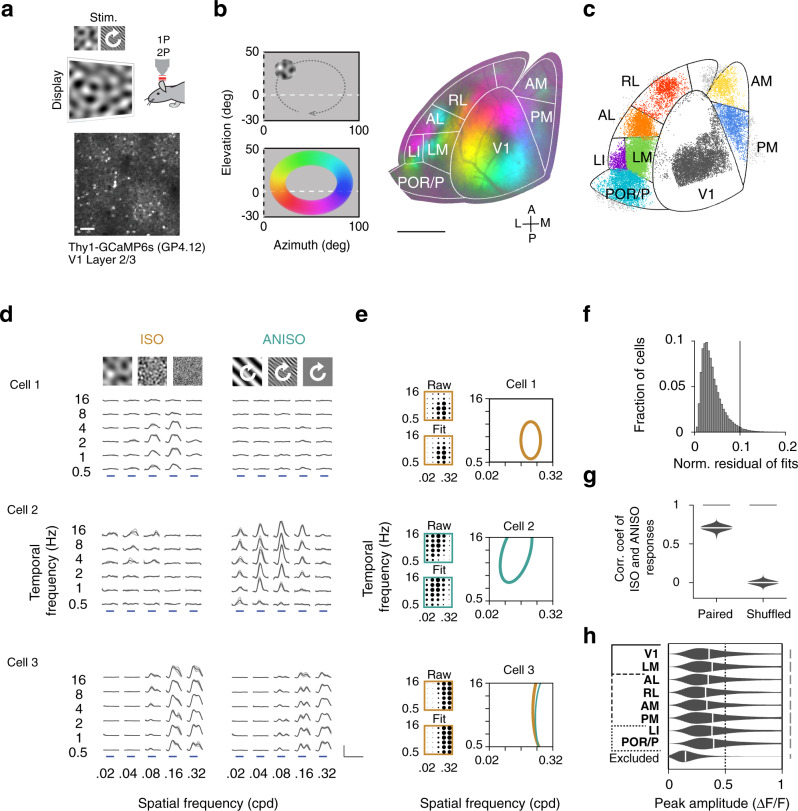
Fig. 1. Characterization of mouse visual cortical areas with spatiotemporal noise stimuli.
a Characterization of visual cortical neurons in primary visual cortex (V1) and higher visual areas (HVAs) in mice. Thy1-GCaMP6s mice (line GP4.12, N = 10 mice) were head-fixed during visual stimulation and imaging. Spatially isotropic (ISO) and anisotropic (ANISO) visual noise stimuli of specific spatial and temporal frequencies and orientations were presented to the right visual hemifield (azimuth 0–100 deg; elevation −30–50 deg) (top). While the ISO stimuli had constant frequency spectra, the orientation of the ANISO stimuli was varied slowly to activate neurons with a spectrum of orientation preferences (white arrow). GCaMP6s labeled L2/3 cortical pyramidal neurons in the left visual cortex (bottom) were imaged using 2-photon (2P) microscopy through a cranial glass window. Scale bar: 100 µm. b Retinotopic mapping of mouse visual cortical areas. The borders of primary visual cortex (V1) and higher visual areas (HVAs) were identified using 1-photon (1P) widefield calcium imaging of responses to a clockwise circling visual stimulus. Stimulation at different visual field locations (left) activates different regions of the visual cortex (right). This activation pattern (color coded) was used to align the cortical surface to a common area delineation. Scale bar: 1 mm. c Distribution of functionally-characterized neurons within the common area delineation. Color-coded dots indicate the estimated neurons’ cell body locations and assigned visual areas. Neurons with cell bodies located outside the common delineation (light gray dots) were excluded from the analysis. d Example calcium responses to ISO (left) and ANISO stimuli (right) for three simultaneously recorded neurons. The neurons show distinct spatiotemporal selectivity and distinct preferences for ISO and ANISO stimuli (top to bottom). Gray traces and light gray shadows: median ± median absolute deviation (4 trials). Blue bars: 4s stimulus epochs. Scale bars: 1 ΔF/F and 10 s. e Model-based estimation of spatiotemporal frequency tuning. Dot plots show average normalized response amplitudes (encoded as dot surface area) as a function of spatial and temporal frequency (upper left) and amplitudes from the corresponding 2-dimensional Gaussian function fits (bottom left). Right panel: Contours show halfmaximum of responses to ISO (yellow curves) and ANISO stimuli (green curves) estimated from model fits. For each neuron, the fit with maximal peak response (thick curves) was selected for further analysis. f Histogram shows the distribution of normalized residuals of fits (root mean squared errors divided by the peak amplitude) across the characterized neural population. Good quality fits (<0.1) were obtained for most cells with reliable responses (26,659/27,701 neurons, datasets 1 or 2). g Mean Pearson’s correlation coefficients of responses to ISO stimuli between paired vs. randomly-shuffled responses to ANISO stimuli (100 cells per bootstrap subsampling, n = 1000 iterations). Two-sample KS test, p<0.001. ISO and ANISO stimuli yield similar measurements of spatiotemporal tuning (10,811 neurons responding to both ISO and ANISO stimuli, 10 mice). h Peak response amplitudes of selected and excluded neurons. For each distribution in g and h: kernel density estimator bandwidth 0.05; scale bar: 2.5% cells; black vertical bars: median value.

