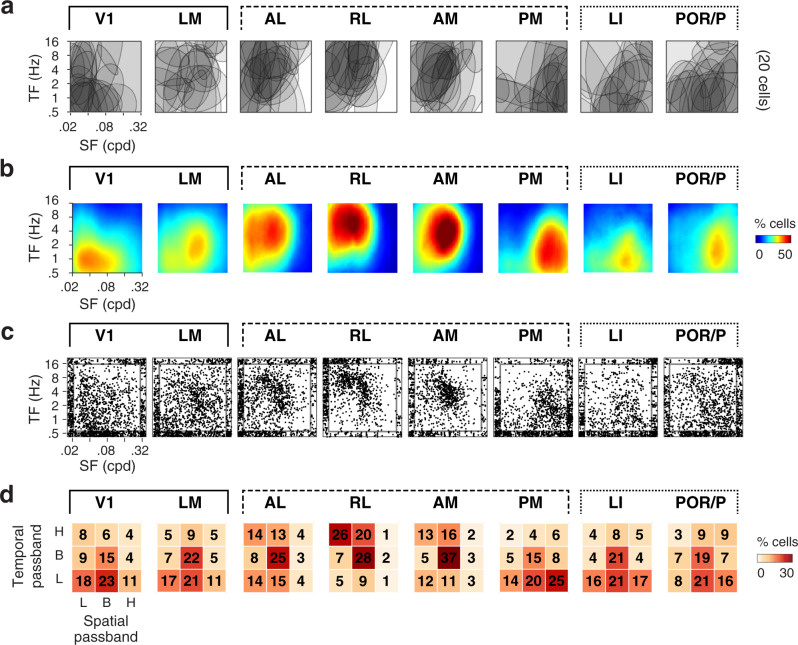
Fig. 2. Comparison of spatiotemporal frequency representations in V1, LM, and dorsal and ventral visual areas.
For each characterized visual area: a Example spatiotemporal tuning. Overlaid halfmaximum regions of 2-dimensional spatiotemporal tuning for 20 randomly-selected cells. b Fraction of activated neurons as a function of center spatial and temporal frequency computed by averaging normalized half-maximum regions of tuning fits. Note how distinct visual areas respond to distinct ranges of spatiotemporal frequencies. c Scatter plots showing the distributions of peak spatiotemporal frequencies. Data points scattered at graph edges correspond to data points at the outer limits of spatial and temporal frequencies tested. d Fraction of neurons for each spatiotemporal tuning shape (H: high pass. B: band pass. L: low pass).

