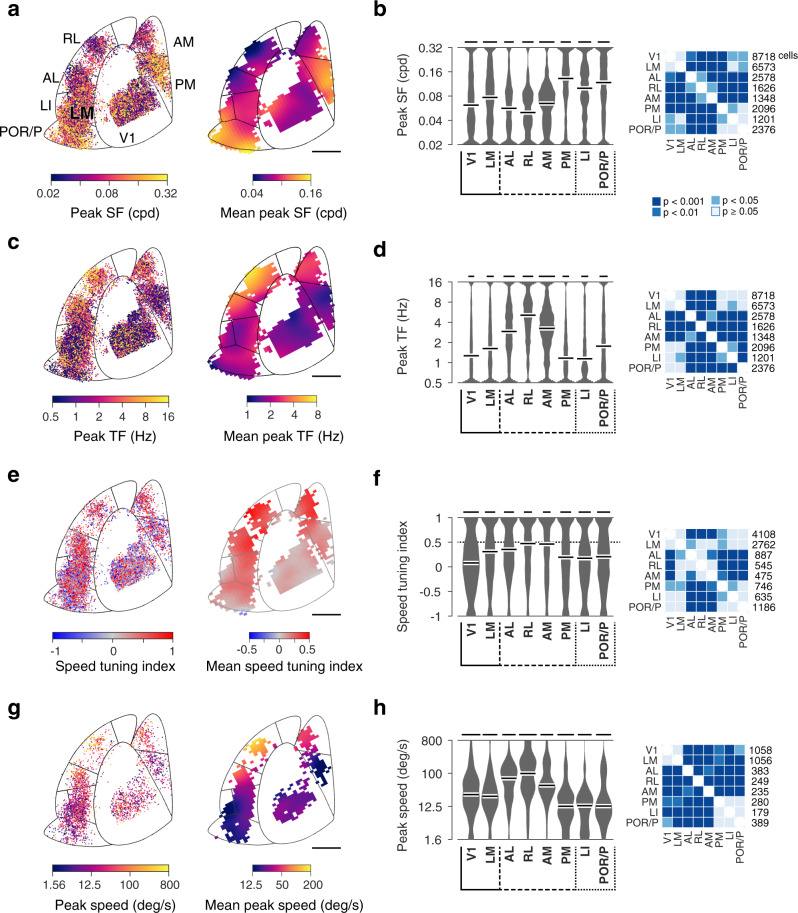
Fig. 3. Comparison of spatial and temporal frequency preferences, speed selectivity and preference in V1, LM and dorsal and ventral visual areas.
a Distributions of observed spatial frequency preferences across visual cortical areas. Left: color-coded map of peak spatial frequency for individual neurons as function of cortical location. Right: spatially-smoothed map (Gaussian filter width 400 µm). Data across animals (n = 10) presented within the common delineation. Scale bar: 1mm. b Left: Probability density functions of observed peak spatial frequency preferences for each visual area. Kernel density estimator bandwidth 0.05; scale bar: 2% cells; white bars: median value. Right: two-sided hierarchical bootstrap KS tests assessing statistical significance of differences in density functions across visual areas accounting for inter-animal variability; see details in Methods. c, d Distributions of peak temporal frequency preferences across areas, same format as a and b. e and f Distributions of speed tuning index (SI) across areas, same format as a and b. The dashed line indicates the selection threshold for speed-tuned cells (SI > 0.5, dataset 1). g, h Distributions of peak speed of speed-tuned cells, same format as a and b. SF: spatial frequency. TF: temporal frequency. Scale bars in d, f, h represent 1.5, 1, 0.5% cells, respectively.

