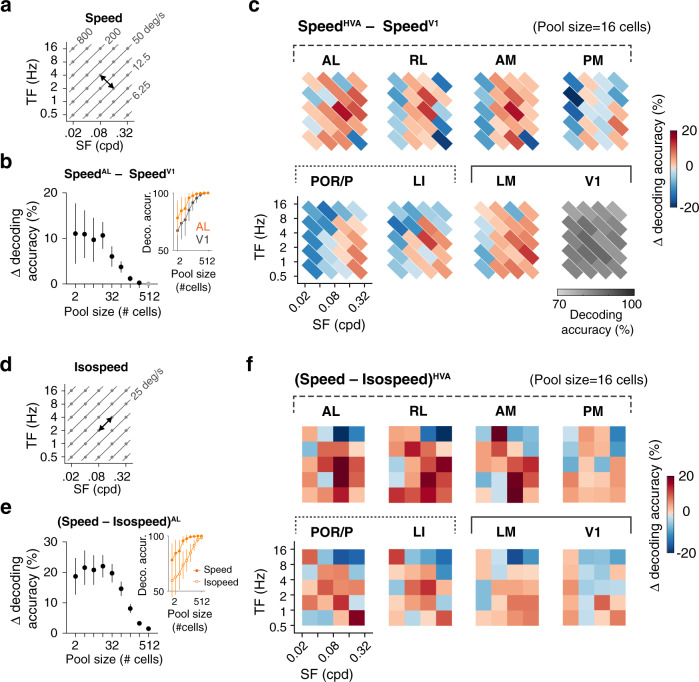
Fig. 4. Neural decoding reveals enhanced speed discrimination in higher visual areas.
a Decoding neural responses to spatiotemporal stimuli of different speed (speed pairs). Speed pairs are sampled orthogonally to iso-speed lines and have a 4-fold difference in speed. b Fractional difference of decoding accuracy in area AL relative to V1, for the speed pair shown in a. The difference varies as a function of the size of the decoding neuron ensemble (pool size). The curve is calculated based on the speed decoding performance of AL and V1 data (inset, the chance level at 50% accuracy; n = 50 randomizations; mean ± 95% confidence intervals). Two-sample t-tests. Significant differences are shown as black markers, otherwise gray markers. c Summary of differences in speed decoding performance in higher visual areas relative to V1. V1 speed decoding performance is shown as a reference. See Supplementary Fig. 8b for statistical significances. Pool size: 16 cells. d Decoding neural responses to stimuli of different spatiotemporal frequencies but identical visual motion speed (iso-speed pairs). e Fractional difference of decoding accuracy observed when comparing results for the speed and iso-speed pairs shown in a and d, in area AL. Note the increased decoding performance for the speed pair relative to the iso-speed pair. Solid circle: speed pair. Open circle: iso-speed pair. Same style as b. f Summary of differences in decoding accuracy between speed pairs and corresponding iso-speed pairs in different areas. See Supplementary Fig. 8d for statistical significances. Pool size: 16 cells.

