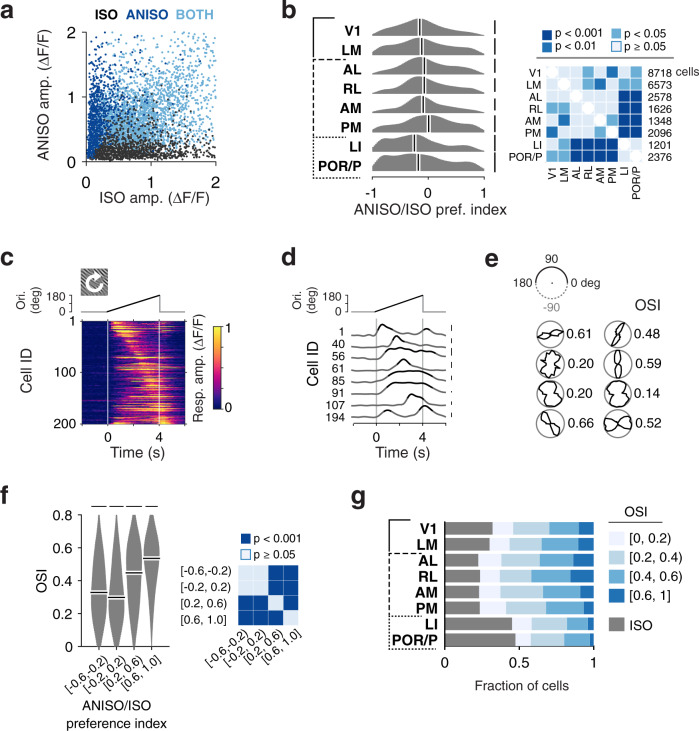
Fig. 5. Diverse responses to oriented and non-oriented stimuli in ventral and dorsal visual areas.
a Scatter plot showing diverse amplitudes of visual cortical neurons’ responses to isotropic (ISO) and anisotropic (ANISO) stimuli (datasets 1–2). Dark blue, gray, and light blue dots represent cells showing reliable responses to ANISO stimuli only, ISO stimuli only, and to both types of stimuli, respectively. b Quantification of neurons’ ANISO/ISO preference for populations in each area. The ANISO/ISO preference index (API) is defined as the ratio of the difference in peak responses to the stimuli over their sum. For each distribution: Kernel density estimator bandwidth 0.1; scale bar: 2% cells; white bars: median value. Right panel: two-sided hierarchical bootstrap KS tests for pairwise comparison. c Calcium traces of 200 randomly-selected V1 neurons in response to ANISO stimuli of time-varying orientation (icon, top inset). In these recordings, time to response peak and response dynamics can be used to estimate orientation preference and selectivity, respectively. Vertical lines at 0 and 4 s indicate onset and offset of visual stimulus. The top inset indicates the time-varying orientation of the visual stimulus. d Subset of the data shown in c plotted as traces. The part over 50% peak amplitudes in each trace is shown in black. Scale bar: 0.3 ΔF/F. e Approximate orientation tuning curves estimated from the response time courses shown as polar plots, for example neurons in d (left to right, top to bottom). Black curves show peak-normalized calcium response amplitudes to different orientations. The upper half of the polar plot is duplicated, rotated, and shown in the lower half, presented together to add visual ease. Estimated orientation selectivity index (OSI), quantified as (1–circular variance), is indicated for each neuron (details in Methods, Supplementary Fig. 11). f Distributions of OSI values for cells with distinct ranges of ANISO preference index. Neurons with high API values show high OSI values indicative of sharp orientation tuning, whereas neurons with low API values show lower OSI values indicative of weaker orientation selectivity. Scale bars: 2.5% cells. Two-sided hierarchical bootstrap KS tests (right panel). g Fraction of neurons showing different orientation selectivity in different areas.

