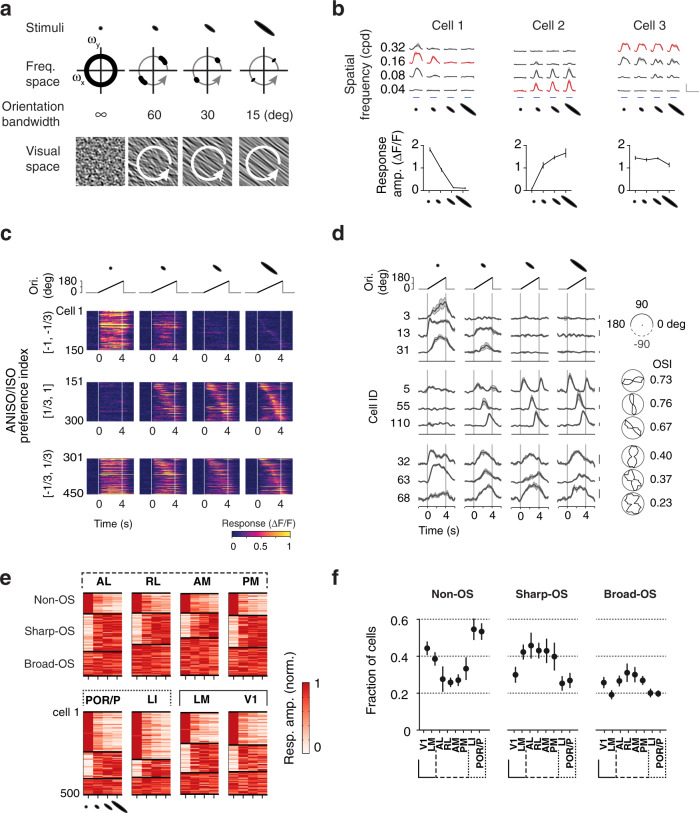
Fig. 6. Discrete response types underlie divergent representations of oriented and non-oriented stimuli.
a Stimuli to investigate the tuning for spatial elongation in visual cortical populations. Varying the orientation bandwidth (top) changes the correlation of orientation over space and hence the elongation of visual patterns (bottom). We recorded responses to a full matrix of stimuli comprising four center spatial frequencies (orientation bandwidth: infinite, 60, 30, 15 deg FWHM) and four orientation bandwidth (center spatial frequency: 0.04, 0.08, 0.16, 0.32 cpd; center temporal frequency 2 Hz) (dataset 3). The orientation of the anisotropic stimuli varied over time within each stimulus epoch (arrows, 45 deg/s). b Example responses illustrating the types of responses observed: isotropic and anisotropic preferring responses (cell 1 and 2) and elongation invariant responses (cell 3). Same cells as in Fig. 1d. The tuning curves (bottom, n = 4 trials) were measured at the neuron’s peak spatial frequency (top, red traces). Scale bar: 1 ΔF/F and 10 s. Mean ± s.e.m. c Heat maps showing example time courses of population responses to stimuli of four distinct orientation bandwidth. Each block shows responses of 150 randomly-selected cells simultaneously-imaged in V1, grouped by ANISO/ISO preference indices (dataset 3, ranges [−1,−1/3], [1/3,1], and [-1/3,1/3]), calculated from the responses to the stimuli with infinite and 15-deg orientation bandwidth. Within blocks, rows (time courses) are sorted according to time to response peak, measured from the 15-deg orientation bandwidth condition (rightmost column). d Calcium traces (left) and polar plots (right) of a random subset of neurons in c. Scale bar: 0.3 ΔF/F. e Color-coded maps of random samples of elongation tuning curves showing the distinct proportions of tuning types in visual areas (500 neurons per area). The three clusters obtained with ward linkage clustering correspond to non-OS, sharp-OS, and broad-OS (OS: orientation selective). In these plots, each row corresponds to one neuron, and each column corresponds to one stimulus condition. Note the uneven representations of the clusters across visual areas. f Fraction of cells belonging to each cluster in each visual area. Means and s.e.m. of the fractions were estimated using hierarchical bootstrapping (n = 10 subsampling, 500 random neurons per area per subsampling).

