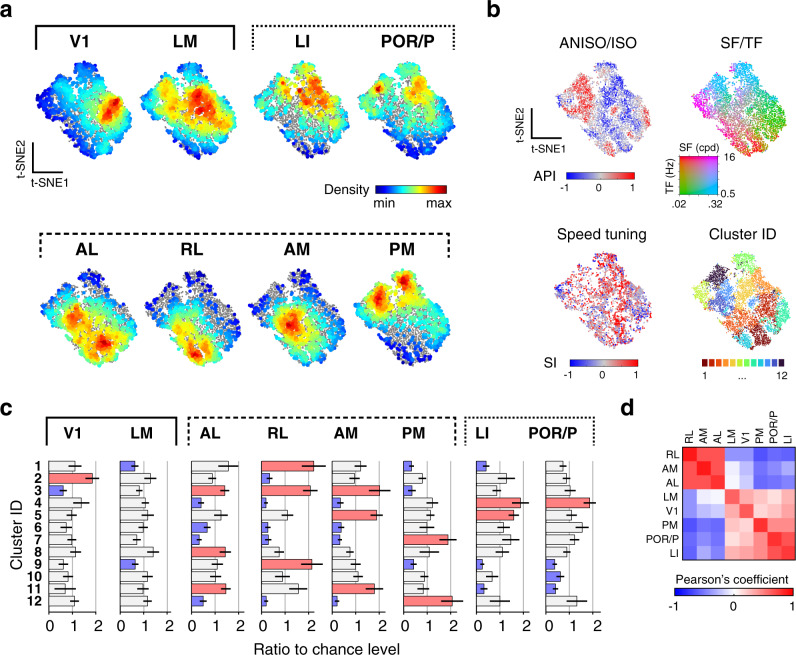
Fig. 8. Diversity of tuning underlying parallel processing streams.
a t-SNE representations of the diversity of joint spatial and spatiotemporal tuning in response to isotropic and anisotropic stimuli within and across visual cortical areas (dataset in Fig. 7). Colored dots show the density of cells of particular tuning for each visual area (2000 randomly sampled neurons per area). Full dataset shown as gray dots in the background for reference. b Functional properties of neurons in the t-SNE representation, showing each cell’s ANISO/ISO preferences index (API, top left), peak spatial and temporal frequencies (top right), speed tuning indices of neurons (SI, bottom left), and cluster affiliation (bottom right). c Bar plots show the representations of the clusters within each area, quantified as the ratio of clusters relative to chance level (1/12). Over- and underrepresented clusters are shown in red and blue, respectively; otherwise, gray. Mean ± s.e.m. (hierarchical bootstrapping, n = 1000 random repetitions). d Pearson’s correlation coefficient of cluster representations between visual areas. Note the anticorrelated representations of tuning in anterior dorsal and ventral areas (AL, AM, RL vs. LI and POR/P). Note also how the tuning representation in area PM differs from that of other dorsal areas.

