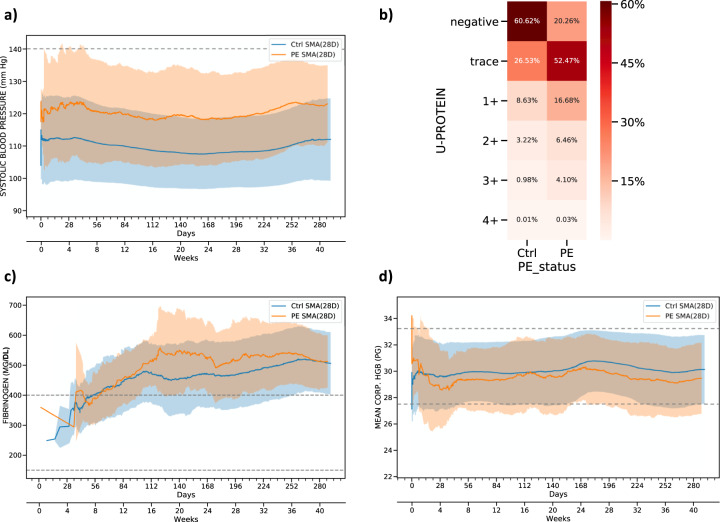
Fig. 4. Feature inspection for antepartum based on moving average.
a 28 days moving average of systolic blood pressure for PE and control patients. The dashed line shows the normal range of systolic blood pressure. b Distribution of urine protein for PE and control patients. c 28 days moving average of fibrinogen for PE and control patients. The dashed line represents the reference ranges for fibrinogen. d 28 days moving average of mean corpuscular hemoglobin (HGB) for PE and control patients. The dashed line represents the normal range of mean corpuscular hemoglobin. In the moving average plots, the shaded areas indicate the standard deviation and solid lines represent the average value across the pregnancy.

