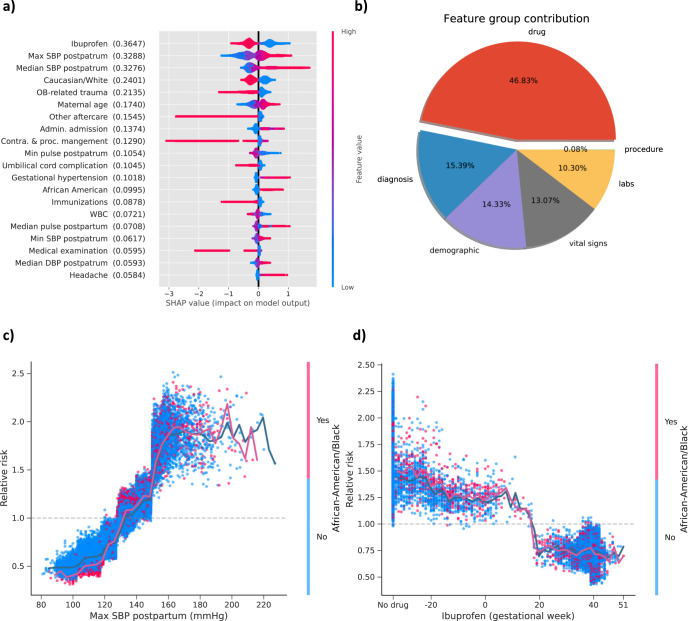
Fig. 6. Feature inspection for postpartum based on SHAP value.
a SHAP summary plot for top 20 features. Features in the summary plot (Y-axis) are ordered by the mean absolute SHAP values (in the parenthesis after each feature name), representing the importance of the feature in driving the postpartum PE prediction. Values of the feature for each patient are colored by their relative value with red signifying high value and blue presenting low value. Positive SHAP values indicate increased risks for postpartum PE and negative values indicate protective effects to postpartum PE. b The average feature category contribution. c The dependence plot of PE relative risk in terms of maximum SBP measured in postpartum. d The dependence plot of PE relative risk versus ibuprofen. The SHAP dependence plots indicate how different values of the features can affect relative risks and ultimately impact classifier decision for SBP and ibuprofen stratified by African American race. The solid line shows the mean of SHAP values.

