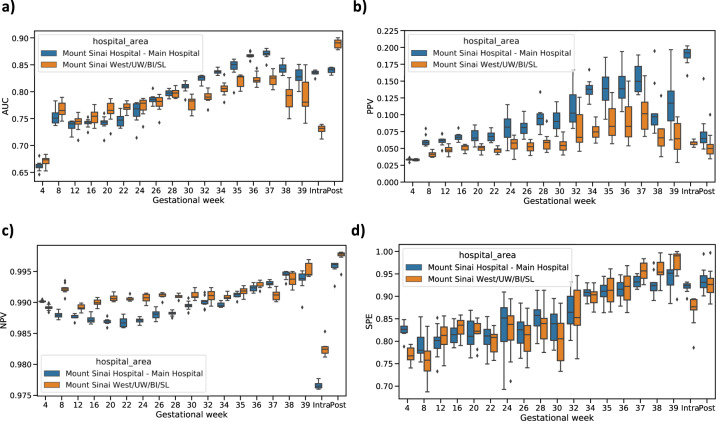
Fig. 7. Model validation on two independent datasets in MSHS.
a Area under receiver operating characteristic curve (AUC) score for each time point. b Positive predictive value (PPV), along with preeclampsia risk in the population, at each time point. c Negative predictive value (NPV) at each time point. d Specificity (SPE) at each time point. Blue boxes indicate the validation in MSH testing set and yellow boxes represent the validation in MSW dataset. The median, interquartile (1st and 3rd) range, and minimum and maximum values, are depicted by the center line, the bounds of the boxes, and the whiskers respectively.

