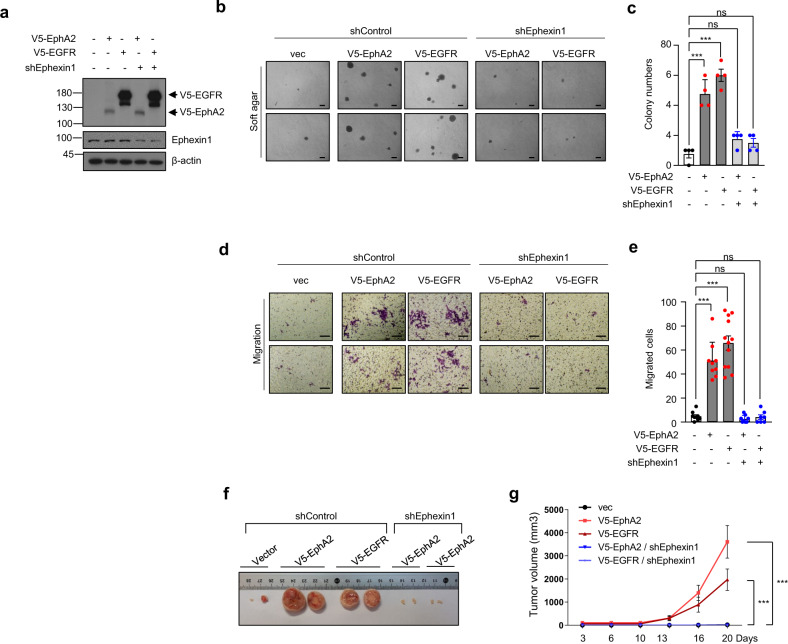
Fig. 5. In the absence of Ephexin1, the tumorigenesis normally induced when EphA2 or EGFR is overexpressed is decreased.
a Western blot analysis using the indicated antibodies of extracts from HEK293T cells stably transfected with V5-tagged EphA2 or V5-tagged EGFR, with or without the shEphexin1 plasmid. b Anchorage-independent growth assay of cells with V5-tagged EphA2 or V5-tagged EGFR, with or without the shEphexin1 plasmid. Representative images are shown. Scale bar = 100 μm. c Quantification of the anchorage-independent growth assay shown in (b). p values are for a two-tailed Student’s t test, ***P < 0.001. ns, not significant. d Migration assay of cells with V5-tagged EphA2 or V5-tagged EGFR, with or without the shEphexin1 plasmid. Representative images are shown. Scale bar = 100 μm. e Quantification of the migration assay shown in (d). p values are for a two-tailed Student’s t test, ***P < 0.001. ns, not significant. f Tumor growth of xenografts in nude mice (n = 4) derived from empty-vector, V5-tagged EphA2 or V5-tagged EGFR along with or without shEphexin1 plasmids in HEK293T cells. Representative images of the tumors at the endpoint of the experiment are shown. g Growth curves of mammary tumors after implantation. Data are shown as mean ± SEM. p values are for a two-way ANOVA, ***P < 0.001.

