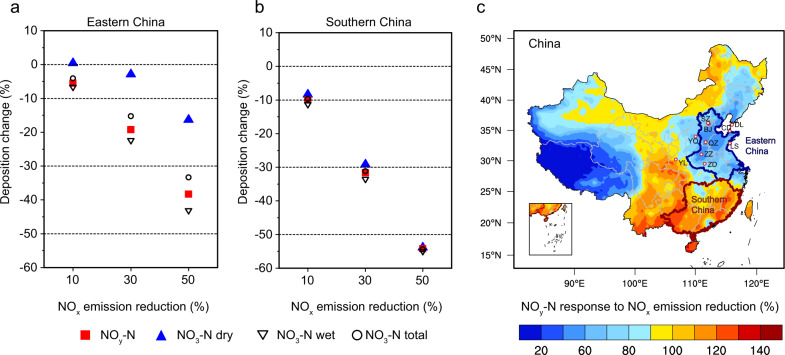
Fig. 2. Response of NOy-N deposition to 10, 30, and 50% reductions of NOx emission.
a The percent changes of NOy-N (NOx and its oxidation products) deposition, NO3-N (nitric acid and nitrogen pentoxide) dry deposition, NO3-N wet deposition, and NO3-N total deposition in Eastern China. b The percent changes of NOy-N deposition forms in Southern China. c Spatial distribution of the relative response of NOy-N deposition to the 30% NOx emission reduction. The dots in panel c denote the ten observation stations for N deposition fluxes during 2011–2015. Note that values of the relative responses less than 100% in c represent the percent reductions of NOy deposition lower than the reductions of NOx emission. The map of China was reproduced from the National Geographic Information Resource Directory Service System (https://github.com/huangynj/NCL-Chinamap.git and https://www.webmap.cn/commres.do?method=result100W).

