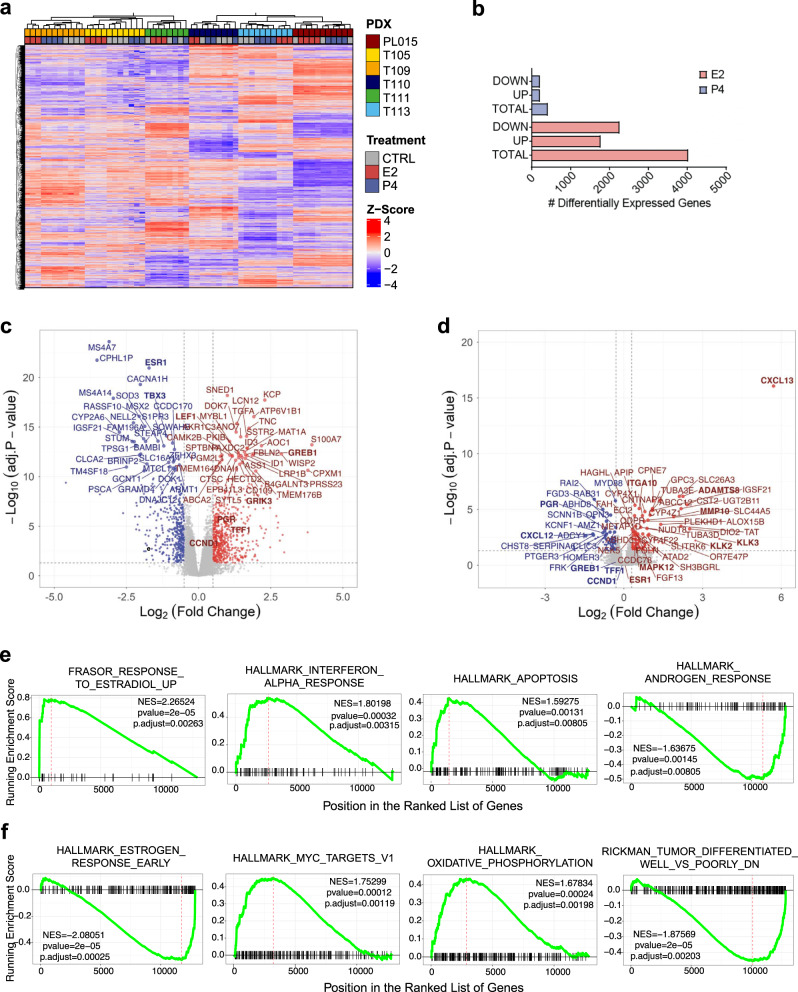
Fig. 4. Transcriptional response of patient-derived tumor cells to E2 and to P4.
a Heatmap showing unsupervised hierarchical clustering of the 500 most variable genes across six PDX samples treated with E2 or P4 or untreated. Normalized expression levels were scaled to Z-scores for each gene, n = 69. b Bar plot showing the number of genes differentially expressed across six different PDXs in response to E2 or P4, adjusted p value cutoff of 0.05, logFC < −0.5 or logFC >0.5. c, d Volcano plot showing differentially expressed genes in response to E2 (c) or P4 (d) across six different PDXs, each 3-4 biological replicates, n = 69. All highlighted genes have p values <0.05 according to the limma model used for differential expression analysis. Genes with log2(FC) >0.5 in red and log2(FC) <0.5 in blue. Names of selected genes are indicated. e, f GSEA showing enrichment of pathways differentially regulated in response to E2 (e) or P4 (f). The red dashed line indicates NES normalized enrichment score.

