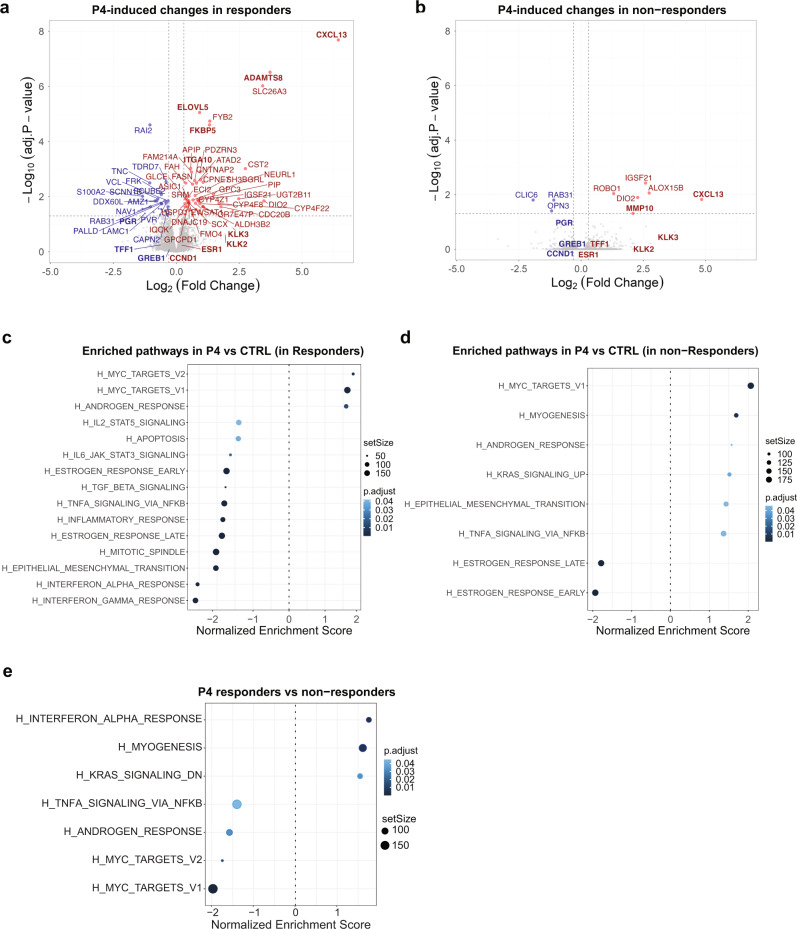
Fig. 5. Transcriptional control of the response to P4.
a, b Volcano plots showing differentially expressed genes in response to P4 in responders a and non-responders b, three different PDXs, each 3-4 biological replicates. All highlighted genes have p values <0.05 according to the limma model used for differential expression analysis. Genes with log2(FC) >0.5 in red and log2(FC) <0.5 in blue. Names of selected genes are indicated. c, d Dot plots showing differentially enriched hallmark gene sets upon P4 stimulation in tumors that respond with proliferation to P4 (responders) (c) versus tumors that do not (non-responders) (d), three different PDXs, each 3-4 biological replicates. e Dot plot showing differentially enriched hallmark gene sets in unstimulated tumors that respond with proliferation to P4 (responders) versus tumors that do not (non-responders).

