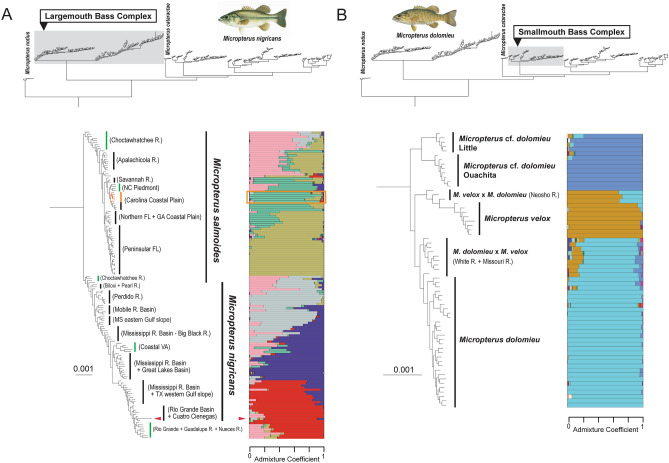
Figure 2.
Maximum likelihood phylogeny inferred from IQ-TREE analysis of concatenated ddRAD dataset for (a) the Largemouth Bass complex and (b) the Smallmouth Bass complex. Population structure (K = 20) inferred from snmf analysis for each species complex are shown to the right of the phylogeny. In the clade delimiting the Largemouth Bass complex (a), population structure assignments and branches leading to specimens from the vicinity of Charleston, South Carolina (type locality of Micropterus salmoides) are highlighted in orange. Green vertical bars indicate populations of genetic admixture between M. nigricans and M. salmoides that are identified in TreeMix analysis. Red arrows indicate the phylogenetic placement and population structure assignment of a specimen sampled from Cuatro Ciénegas. See Supplementary Fig. S1 for a completely annotated phylogeny tip labels and bootstrap supports values. Illustrations © Joseph R. Tomelleri, used with permission.

