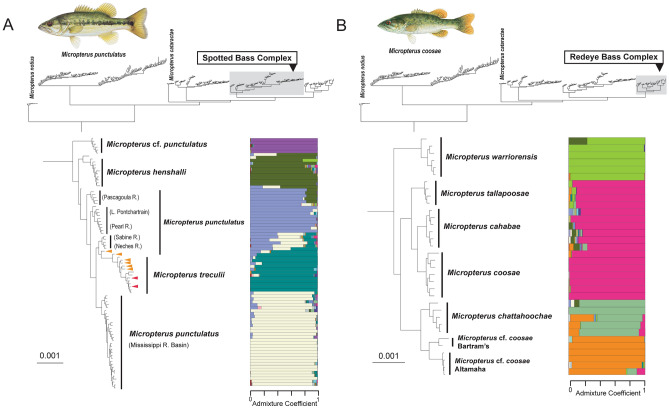
Figure 3.
Maximum likelihood phylogeny inferred from IQ-TREE analysis of concatenated ddRAD dataset for (a) the Spotted Bass complex and (b) the Redeye Bass complex. Population structure (K = 20) inferred from snmf analysis for each species complex are re shown to the right of the phylogeny. In the clade delimiting the Spotted Bass complex (a), orange and red arrows indicate specimens from the Brazos and Colorado rivers, respectively, that are identified morphologically as Micropterus punctulatus. See Supplementary Fig. S1 for a completely annotated phylogeny tip labels and bootstrap supports values. Illustrations © Joseph R. Tomelleri, used with permission.

