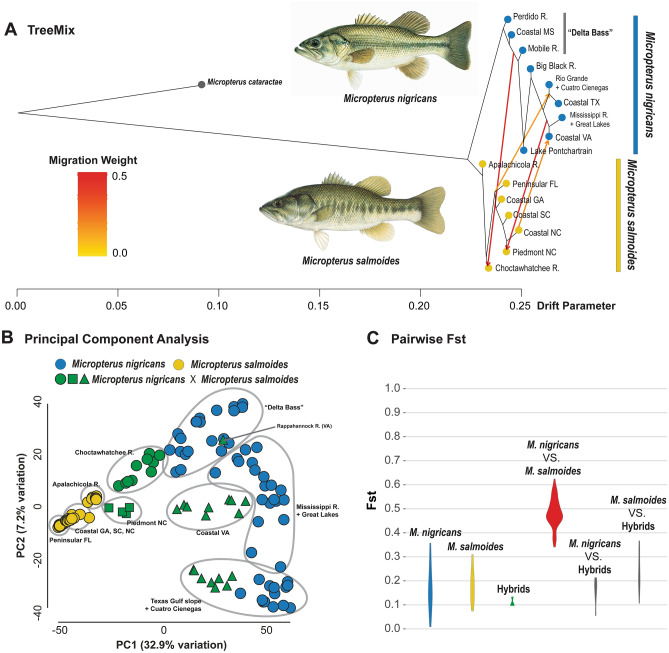
Figure 5.
(a) Migration edges between Micropterus nigricans and M. salmoides, inferred from TreeMix analysis. Arrows show relative magnitude and direction of gene flow among populations of the Largemouth Bass complex. (b) Principal component analysis (PCA) of genetic variance for species of the Largemouth Bass complex. Grey ellipses indicate major geographic populations or lineages of the Largemouth Bass complex. We separate populations that are genetically admixed between Micropterus nigricans and Micropterus salmoides by origin of genetic admixture: presumably natural secondary contract (green circles); uncertain (green rectangles); and human-mediated origin (green triangles). (c) Violin plots for ranges of pairwise Fst values among populations within Micropterus nigricans, M. salmoides, and genetic admixtures (Choctawhatchee and North Carolina Piedmont) and between each pair of the three groups. Pairwise Fst values between populations of Micropterus nigricans and M. salmoides are considerably higher than other pairs in comparison. Illustrations © Joseph R. Tomelleri, used with permission.

