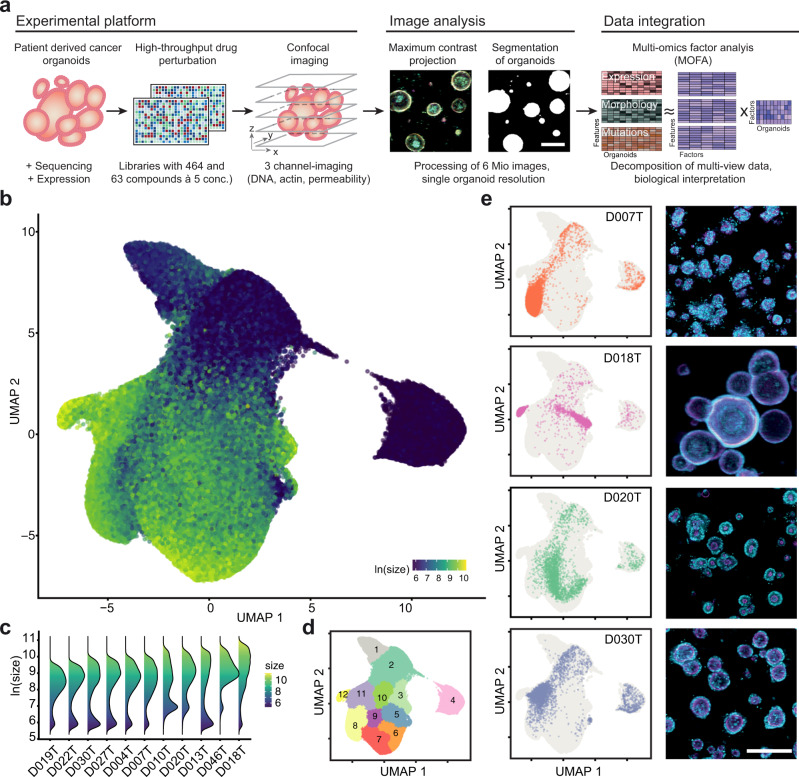
Fig. 1. Image-based profiling captures the phenotype diversity of patient-derived cancer organoids.
a Schematic overview of experiments: Organoids were isolated from endoscopic biopsies from patients with colorectal cancer. Organoids were dissociated and evenly seeded in 384-well plates before perturbation with an experimental (464 compounds) and a clinical compound library (63 compounds at 5 concentrations each, 842 perturbations across both libraries). After treatment, high-throughput fluorescence microscopy was used to capture the morphology of organoids. The multi-channel (DNA, beta-actin, cell permeability) 3D imaging data was projected, segmented, and phenotype features were extracted to quantify potential drug-induced phenotypes. Untreated organoid morphology, organoid size and drug activity scores were integrated with mRNA expression and mutation data in a Multi-Omics Factor Analysis (MOFA). b Uniform Manifold Approximation and Projection (UMAP) of organoid-level features for a random 5% sample out of approximately 5.5 million organoids. The same sample is used for visualizations throughout the figure. Color corresponds to the log-scaled organoid area (dark blue: minimum size, yellow: maximum size). c Organoid size distribution across organoid lines. d UMAP representation of DMSO treated and drug treated organoids. Graph-based clustering of organoids by morphology with 12 resulting clusters. e UMAP embeddings of selected organoid lines (baseline state = 0.1% DMSO control-treated organoids) representing different morphological subsets, grey background consists of randomly sampled points. Depicted are representative example images for each organoid line (right, cyan = DNA, magenta = actin, scale bar: 200 µm).

