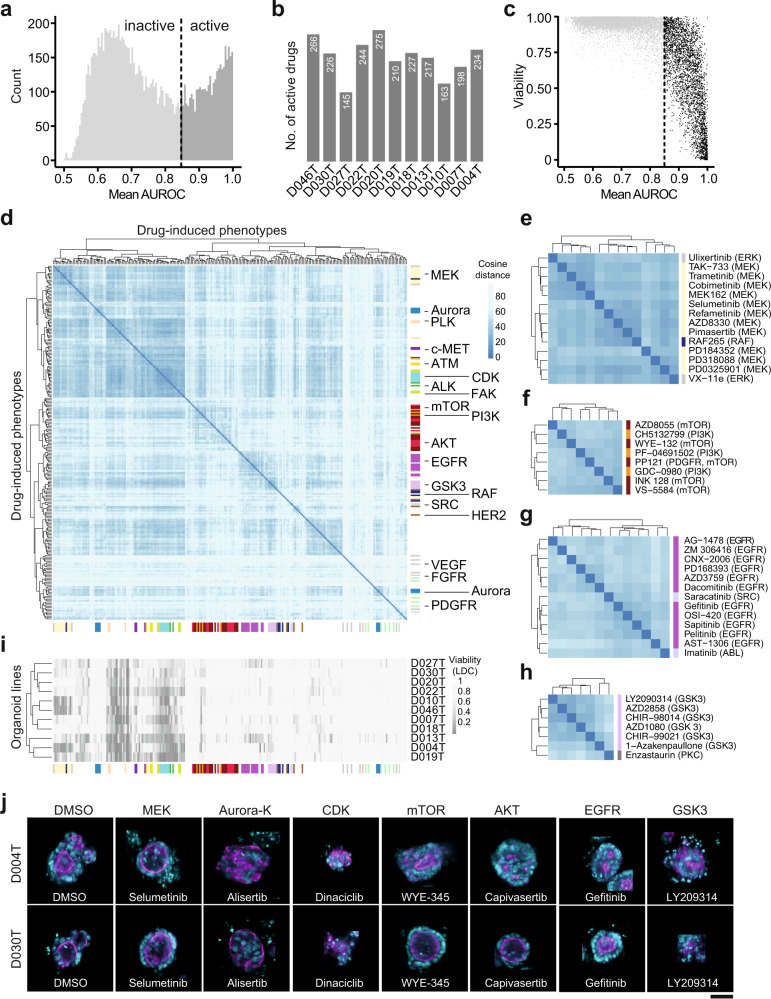
Fig. 3. Drug-induced organoid phenotypes correspond to drug mechanism of action.
a Histogram of average model performance for each tested drug. For every tested drug and organoid line, logistic regression models were trained to distinguish negative control-treated organoids from drug treated organoids. A drug was considered “active” when it induced a phenotype that could be separated from DMSO control-phenotypes with a mean classification performance of >0.85 area under the receiver operating characteristic curve (AUROC). b Number of active drugs per organoid line. c Relationship between drug-induced viability change (predicted by LDC, compare Fig. 2) and general compound activity. d Unsupervised clustering of drug effect profiles for active drugs. Distance between drug effect profiles was calculated using cosine similarity. Drug effect profiles were determined by fitting logistic regression models between treated and untreated organoids for each drug and line. PCA transformed morphology information was used as input features. Fisher’s exact test was used to identify enrichments of drugs annotated with the same drug target within the hierarchical clustering. Tested clusters had a minimum cluster size of 3 and were evaluated iteratively from the tree bottom to top. Colors on the side of the heatmap represent drug mechanisms of action. e–h Zoom-ins of (d) showing clusters enriched for MEK (e), PI3K/mTOR (f), EGFR (g) and GSK-3 (h). i Viability of drug-induced phenotypes in individual organoid lines as determined by supervised machine learning. The drugs were arranged on the x axis in the same order as in (d). j Organoids representative of selected drug-induced phenotypes. Images from organoid lines D004T and D030T were selected for each organoid phenotype, automatically cropped and embedded in black background. Cyan = DNA, magenta = actin; scale bar: 50 µm.

