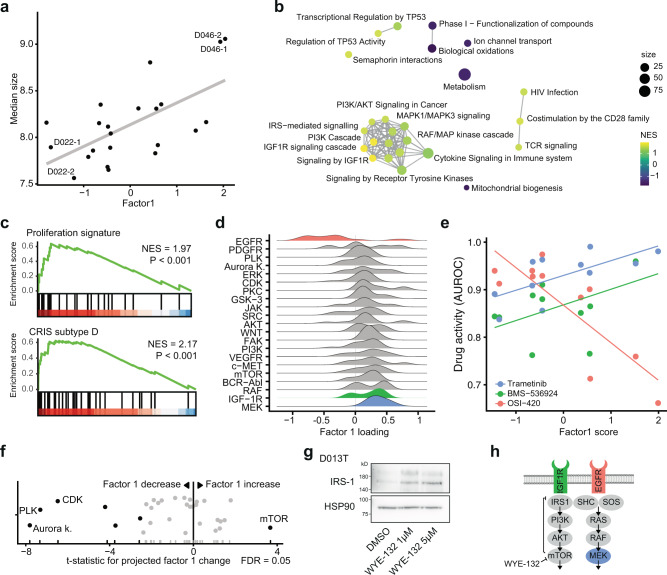
Fig. 6. An IGF1R signaling program is associated with increased organoid size, EGFR inhibitor resistance and can be induced by mTOR inhibition.
a Association of factor 1 with organoid size. Source data are provided as a Source Data file. b Gene-set enrichment network of factor 1 gene expression loadings. An edge connects Reactome pathways with more than 20% overlap. c Gene set enrichment results of the “proliferation” intestinal signature and the colorectal cancer CRIS-D subtype over ranked factor 1 gene expression loadings (ranking from high factor 1 loading to low factor 1 loading), NES = normalized enrichment score, statistics were calculated with GSEA using 100.000 permutations. d Distributions of drug activity loadings grouped by drug targets for factor 1. e Relationship of selected drugs’ activity (AUROC) with factor 1 score. Source data are provided as a Source Data file. Further examples can be found in Supplementary Fig. S8. f Projection of factor 1 scores for drug-induced phenotypes. Highlighted are drug targets leading to a significant change in projected factor scores across all organoid lines (ANOVA). Source data are provided as a Source Data file. g Western blot of IRS-1 protein abundance under mTOR inhibition. A representative blot of three biological replicates with organoid line D013T is shown. Scans of complete membranes are shown in Supplementary Fig. S9. Source data are provided as a Source Data file. h Illustration of IGF1R signaling pathway with highlighted drug targets. Shown is the disinhibition of mTOR mediated IRS-1 repression by mTOR inhibitors.

