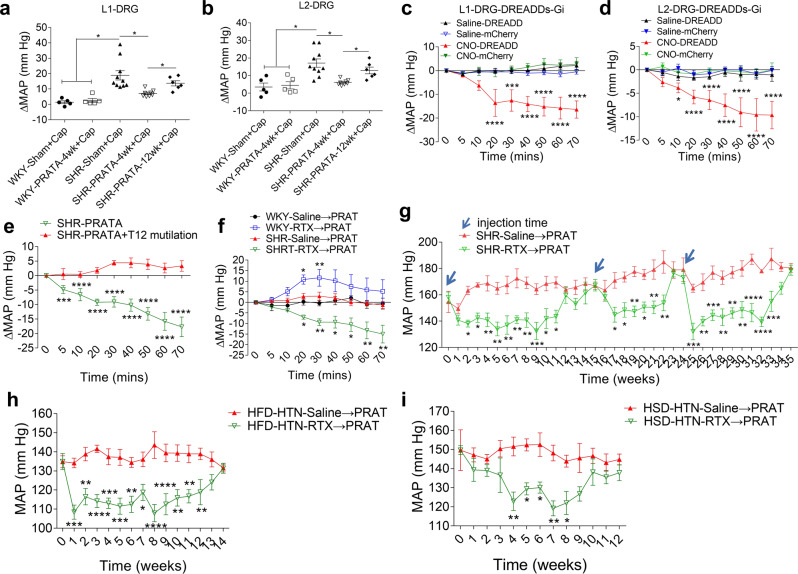
Fig. 3. Enhanced L1-L2 DRG neuron activity as a regulator for high BP.
a, b Changes of intracarotid arterial MAP under L1-L2 DRG injection with capsaicin post PRATA, n = 5 for WKY-Sham + Cap and WKY-PRATA-4wk + Cap groups, n = 10 for SHR-Sham + Cap group, n = 8 for SHR-PRATA-4wk + Cap group, n = 6 for SHR-PRATA-12wk + Cap group; Data are mean ± SEM. *P < 0.05. ANOVA, Bonferroni post-hoc test, two-sided. c, d Changes of the intracarotid arterial MAP after selective inhibition of neuronal activity of L1-L2 DRGs using Gi-DREADDs in SHR, n = 5 for Saline-DREADD and CNO-DREADD group, n = 6 for Saline-mCherry and CNO-mCherry group; Data are mean ± SEM. *P < 0.05, ***P < 0.001, ****P < 0.0001 compared with Saline-DREADD group. ANOVA, Bonferroni post-hoc test, two-sided. e Changes of the intracarotid arterial MAP post PRATA with or without T12 spinal cord mutilation, n = 6 for SHR-PRATA group, n = 5 for SHR-PRATA + T12 mutilation group; Data are mean ± SEM. ***P < 0.001, ****P < 0.0001. ANOVA, Bonferroni post-hoc test, two-sided. f Changes of the intracarotid arterial MAP post PRAT denervation by RTX in SHRs, n = 6 per group; Data are mean ± SEM. *P < 0.05, **P < 0.01. ANOVA, Bonferroni post-hoc test, two-sided. g Weekly measurement of tail arterial BP post three repeated PRATD by RTX in SHRs, n = 6 per group; Data are mean ± SEM. *P < 0.05, **P < 0.01, ***P < 0.001, ****P < 0.0001. ANOVA, Bonferroni post-hoc test, two-sided. h, i Weekly measurement of tail arterial BP post PRATD in HFD induced hypertensive rats (h) and HSD induced hypertensive rats (i), n = 8 for HFD-HTN-Saline→PRAT group, n = 7 for HFD-HTN-RTX → PRAT group in (h); n = 7 per group in (i); Data are mean ± SEM. *P < 0.05, **P < 0.01, ***P < 0.001, ****P < 0.0001. ANOVA, Bonferroni post-hoc test, two-sided. Saline→PRAT: injection of saline into perirenal adipose tissue, RTX → PRAT: injection of resiniferatoxin into perirenal adipose tissue.

