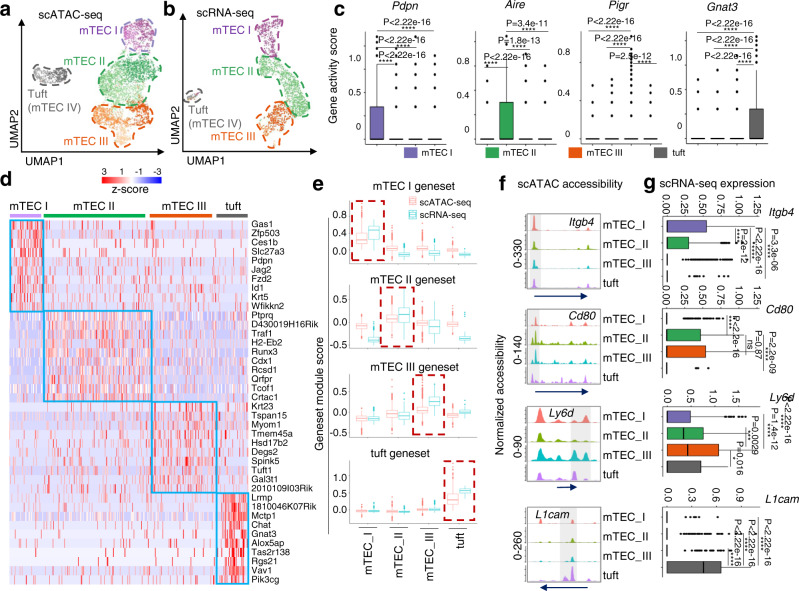
Fig. 1. Chromatin accessibility profiling of mTECs was established according to the known single-cell transcriptional profile.
a UMAP visualization of scATAC-seq profiles of mTECs. Cell types are circled with dotted lines of different colors. b UMAP visualization of scRNA-seq profiles of mTECs. Cell types are circled with dotted lines of different colors. c Boxplots show marker genes for each mTEC cluster by gene accessibility matrix. Color represents specific clusters of mTECs. mTEC I: n = 638, mTEC II: n = 1982, mTEC III: n = 1262, thymic tuft cells: n = 495. d Heatmap of the gene expression profile of defined mTEC populations in scATAC-seq was generated by the top ten marker genes from the gene activity matrix. The color scale indicates the level of gene activity. e Marker genes of each mTEC population calculated by scRNA-seq were added to both scRNA-seq and scATAC-seq. Gene set module scores in scRNA-seq (blue) and scATAC-seq (red) were compared with boxplots. f Genome tracks of aggregate scATAC-seq data show marker chromatin accessibility peaks. The arrow indicates the length and direction of the genes detected by scATAC-seq. g Boxplots show normalized expression of the marker genes for each mTEC cluster in scRNA-seq data. mTEC I: n = 364, mTEC II: n = 991, mTEC III: n = 458, thymic tuft cells: n = 62. The statistics was determined using Wilcoxon signed-rank test. ****p < 0.001.

