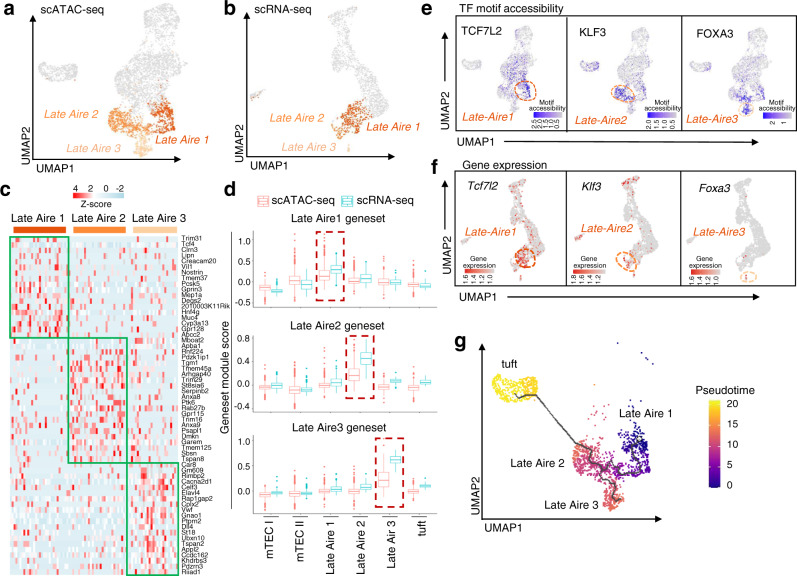
Fig. 2. Chromatin accessibility, gene expression, and differentiation trajectory of three newly identified mTEC III subsets.
UMAP visualization of scATAC-seq profiles (a) and scRNA-seq profiles (b). Late Aire 1, Late Aire 2, and Late Aire 3 cells labeled with different colors are defined by the different chromatin accessibility in scATAC-seq and scRNA-seq profiles. c Heatmap of the gene expression profile of late Aire 1–3 populations in scATAC-seq was generated by the top 20 marker genes from the gene activity matrix. The color scale indicates the level of gene activity. d Marker genes of each Late Aire population calculated by scATAC-seq were added to both scRNA-seq and scATAC-seq. The gene set module scores of Late Aire 1-3 in scRNA-seq (blue) and scATAC-seq (red) were compared in boxplots. e UMAP visualization of TF motif accessibility for the indicated TFs in Late Aire 1, Late Aire 2, and Late Aire 3 cells. The blue scale in the UMAP plot indicates the level of TF motif accessibility in scATAC-seq analyzed by chromVAR. f UMAP visualization of scRNA-seq colored based on the expression of the indicated TFs in Late Aire 1, Late Aire 2, and Late Aire 3 cells. The red scale in UMAP plot indicate the level of gene expression in scRNA-seq. g UMAP visualization of scATAC-seq subsets of Late Aire 1, Late Aire 2, Late Aire 3, and thymic tuft cells. Colored based on the pseudotime, with blue corresponding to early cells and yellow corresponding to thymic tuft cells.

