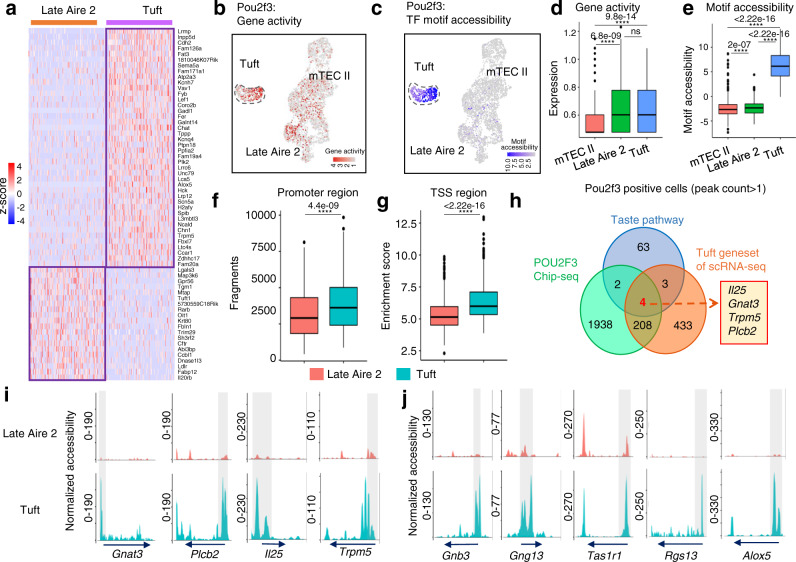
Fig. 3. Pou2f3 but not its target genes are expressed before Late Aire 2, and chromatin opening is required for target gene expression in thymic tuft cells.
a Heatmap of differentially accessible genes between Late Aire 2 cells and thymic tuft cells in scATAC-seq. The color scale indicates the level of gene activity. b UMAP visualization of the gene expression of Pou2f3 in scRNA-seq. c UMAP visualization of the motif accessibility score of Pou2f3 in scATAC-seq. d Gene expression of Pou2f3 in Pou2f3+ mTEC subsets in scATAC-seq was compared in a boxplot. Pou2f3+ mTEC II: n = 499, Pou2f3+ Late Aire 2 cells: n = 210, Pou2f3+ thymic tuft cells: n = 297. e Motif accessibility score of Pou2f3 in Pou2f3+ mTEC subsets in scATAC-seq was compared in a boxplot. Boxplots show the fragments at the promoter region (f) and TSS enrichment score (g) for Late Aire 2 cells (pink) and thymic tuft cells (blue). Late Aire 2 cells: n = 551, thymic tuft cells: n = 495. h Taste pathway-related gene (blue), Pou2f3 directly regulated gene sets (green), and tuft gene sets of scRNA-seq (orange) are calculated in a Venn diagram. The overlapping genes among them are shown on the right. The chromatin accessibility peaks of overlapping genes (i) and tuft-associated genes (j) are shown in scATAC-seq tracks. The arrow indicates the length and direction of the genes detected by scATAC-seq. The statistics was determined using Wilcoxon signed-rank test. ****p < 0.001.

