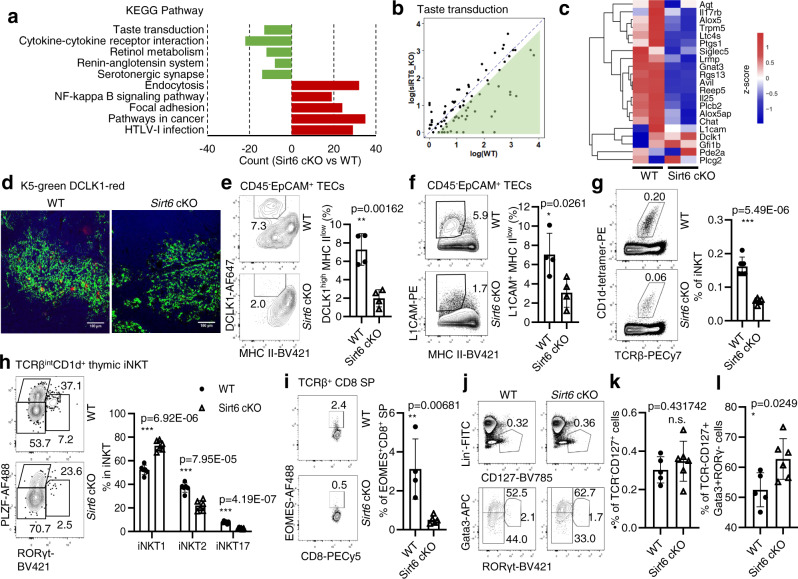
Fig. 4. Sirt6 deletion affects the cell number and function of thymic tuft cells.
a Downregulated genes or upregulated genes in Sirt6-deficient mTECs are enriched in KEGG pathways, and the top five pathways are ordered by p value. All pathways were selected under the standard of p < 0.05. b Scatter plot shows the difference in TPM values of taste transduction genes between WT and Sirt6-deficient mTECs. c Differential expression of thymic tuft cell-related genes between mTECs sorted from WT and Sirt6 cKO mice. The color scale indicates the level of gene expression. d Representative images of frozen thymic sections from WT and Sirt6 cKO mice (n = 4 per group). Green, KRT5. Red, DCLK1. Scale bars: 100 μm. e Representative flow cytometric profiles and frequency of thymic tuft cells (CD45–EpCAM+MHCIIlowDCLK1high) obtained from 4-week-old Sirt6 cKO mice and littermates (n = 4 per group). f Representative flow cytometric profiles and frequency of L1CAM+ thymic tuft cells from 4-week-old Sirt6 cKO mice and littermates (n = 4 per group). g Representative flow cytometric plots and frequency of TCRβintCD1d+ thymic iNKT cells in 4-week-old Sirt6 cKO mice and littermates (n = 6 per group). h Representative flow cytometric plots and frequencies of NKT1 (PLZF–RORγt–), NKT2 (PLZF+RORγt–), and NKT17 (PLZF–RORγt+) in 4-week-old Sirt6 cKO mice and littermates (n = 6 per group). i Representative flow cytometric plots and frequency of EOMES+TCRβ+CD8 single-positive thymocytes in 4-week-old WT (n = 4) and Sirt6 cKO (n = 5) mice. j Representative flow cytometric plots of Lin–TCR–CD127+ thymic ILCs (upper) and ILC subsets (lower) in Sirt6 cKO mice and littermates. k, l Frequencies of Lin–TCR–CD127+ thymic ILCs (k) and Lin–TCR–CD127+Gata3+Rorγt– ILC2s (l) of WT (n = 5) and Sirt6 cKO (n = 6) mice. *p < 0.05, **p < 0.01 and ***p < 0.001 compared with the identical WT control mice (Student’s t-test). The error bar represents one standard deviation.

