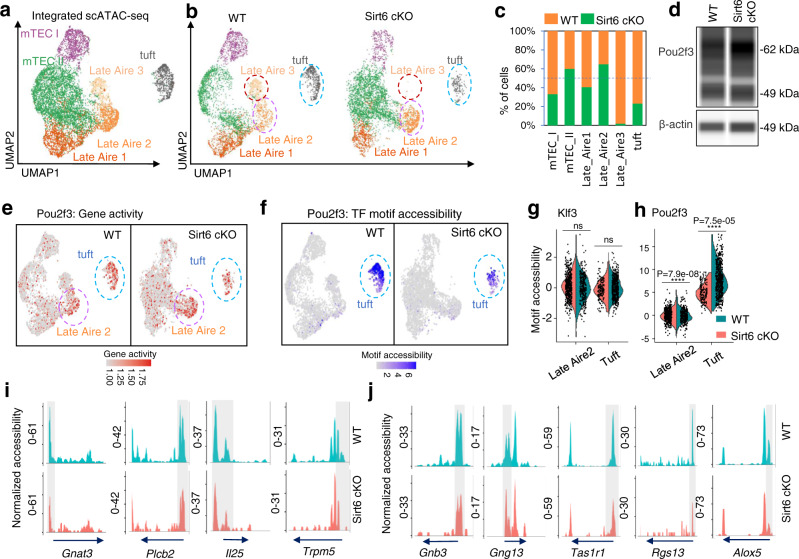
Fig. 5. Chromatin accessibility of the genes regulated by Pou2f3 decreased after Sirt6 deletion.
a, b scATAC-seq data of WT and Sirt6-deficient mTECs are coembedded into a single UMAP visualization (a) and are displayed separately (b). Cells are stained with the mTEC subset defined before. c Relative proportion of mTEC clusters between WT and Sirt6 cKO mice. d Simple Western analysis of POU2F3 expression in sorted mTECs (CD45−EpCAM+UEA-1+Ly51−) from 4-week-old WT and Sirt6 cKO mice. e UMAP visualization of the gene expression of Pou2f3 in WT (left) and Sirt6 cKO (right) scATAC-seq. The red scale in the UMAP plot indicates the level of Pou2f3 gene activity in scATAC-seq f UMAP visualization of the motif accessibility score of Pou2f3 in WT (left) and Sirt6 cKO (right) scATAC-seq. The blue scale in the UMAP plot indicates the level of Pou2f3 motif accessibility in scATAC-seq analyzed by chromVAR. g, h Motif accessibility scores of Klf3 (g) and Pou2f3 (h) in Late Aire 2 cells and thymic tuft cells of WT (Orange) and Sirt6 cKO mice (green) were compared in a violin plot. WT Late Aire 2 cells: n = 272, Sirt6 cKO Late Aire 2 cells: n = 500, WT thymic tuft cells: n = 501, Sirt6 cKO thymic tuft cells: n = 150. i, j Chromatin accessibility peaks of overlapping genes (i) and tuft-associated genes (j) mentioned in Fig. 3 in WT and Sirt6-deficient thymic tuft cells are shown in aggregated scATAC-seq tracks. The arrow indicates the length and direction of the genes detected by scATAC-seq. The statistics was determined using Wilcoxon signed-rank test. *p < 0.05, **p < 0.01, ***p < 0.005 and ****p < 0.001.

