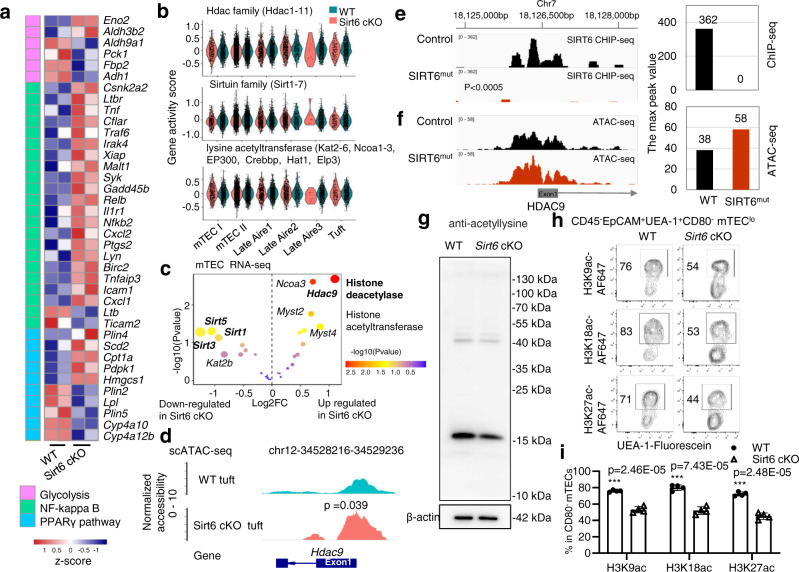
Fig. 6. Decreased chromatin accessibility of Pou2f3-regulated genes was consistent with the decreased acetylation regulated by the SIRT6-HDAC9 axis.
a Glycolysis-, NF-kappaB pathway-, and PPARγ pathway-associated genes were compared between WT and Sirt6 cKO mTEC bulk RNA-seq by heatmap. The color scale indicates the level of gene expression. b Gene set module scores of the histone deacetylase gene family, sirtuin gene family, and histone lysine acetyltransferase gene family were compared between WT (green) and Sirt6 cKO mouse (red) mTEC populations. c Differential expression of the histone deacetylase gene family, sirtuin gene family, and histone lysine acetyltransferase gene family was calculated by DEseq2 using WT and Sirt6 cKO mTEC bulk RNA-seq. The x-axis represents Log2FC, and the y-axis represents −log10 (P value). The dot size is consistent with the |Log2FC| value. Histone deacetylase-related genes are labeled in bold, and histone acetyltransferase-related genes are not labeled in bold. d Chromatin accessibility peaks around the promoter of the Hdac9 gene between WT and Sirt6 cKO thymic tuft cells are shown in aggregated scATAC-seq tracks. The arrow indicates the length and direction of the peak around the promoter region of Hdac9 detected by scATAC-seq. e Capture of the UCSC (GRCh37/hg19) genome browser showing the human HDAC9 locus in ChIP-seq. f Capture of the UCSC (GRCh37/hg19) genome browser showing the human HDAC9 locus in ATAC-seq. g Western blot analysis of protein acetylation in mTECs (CD45−CD326+UEA-1+Ly51−) isolated from wild-type or Sirt6 cKO mice. h Representative flow cytometric profiles of H3K9ac, H3K18ac, and H3K27ac expressed in CD80− mTECs obtained from 4-week-old Sirt6 cKO mice and littermates. i Frequencies of H3K9ac, H3K18ac, and H3K27ac expression in CD80− mTECs of 4-week-old Sirt6 cKO mice and littermates (n = 4 per group). ***p < 0.001 compared with the identical WT control mice (Student’s t-test). The error bar represents one standard deviation.

