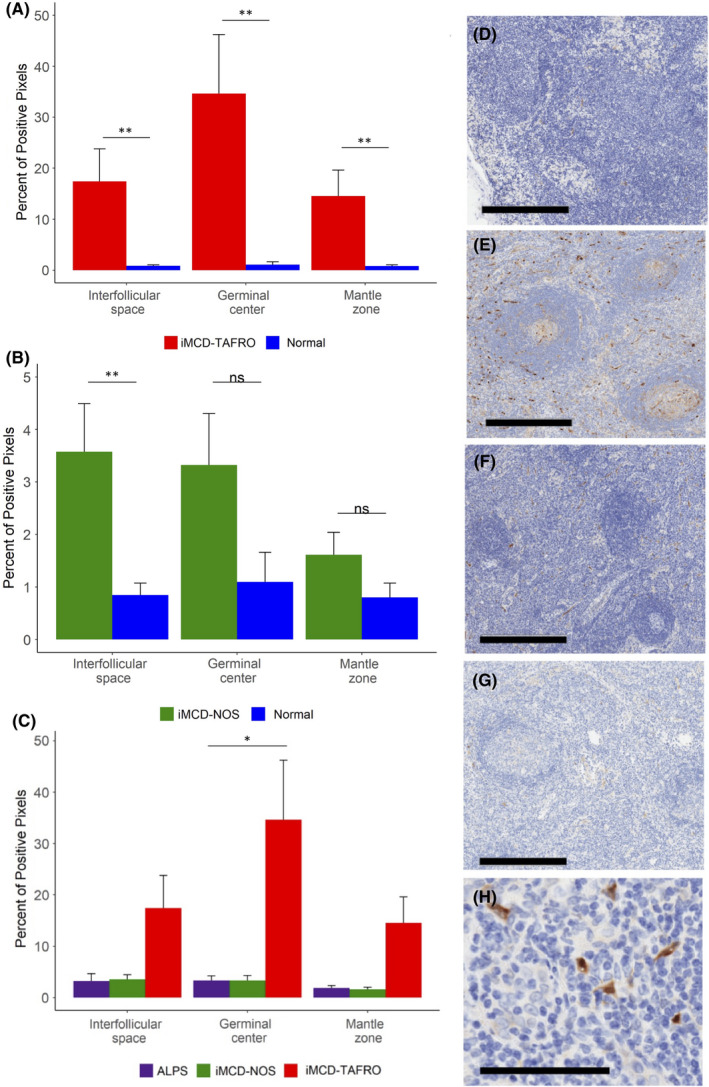
FIGURE 1.

Comparison of pNDRG1 staining across iMCD subtypes and autoimmune lymphoproliferative syndrome (ALPS). (A) Stained pNDRG1 for iMCD‐TAFRO patients (n = 6) and (B) iMCD‐not otherwise specified (iMCD‐NOS) patients (n = 8) compared with a control group of metastasis‐free lymph nodes (normal) (n = 7). Relative to normal lymph nodes, pNDRG1 positive area was significantly elevated in the interfollicular space (p = 0.005), germinal centre (p = 0.002) and mantle zone (p = 0.007) of iMCD‐TAFRO lymph nodes. pNDRG1 positive area was significantly elevated in the interfollicular space (p = 0.005) of iMCD‐NOS lymph nodes relative to normal lymph nodes, but there was no difference in staining in the germinal centres (p = 0.59) and mantle zones (p = 0.30). (C) Stained pNDRG1 area for iMCD‐TAFRO patients (n = 6) and iMCD‐NOS patients (n = 8) compared with ALPS lymph nodes (n = 8). There was a significant increase in positive pNDRG1 staining in iMCD‐TAFRO germinal centres relative to ALPS (p = 0.02), and no difference in the interfollicular space (p = 0.18) and mantle zone (p = 0.11). There was no difference in positive pNDRG1 staining in iMCD‐NOS relative to ALPS in the interfollicular space (p = 1.0), germinal centres (p = 1.0) and mantle zones (p = 1.0). *p <.05, **p <.01. D‐G, Representative images of pNDRG1 (brown) staining for a (D) normal lymph node (E) iMCD‐TAFRO (F) iMCD‐NOS and (G) ALPS lymph node. Haematoxylin counterstain provides a blue nuclear stain to assess cell and tissue morphology. Bar = 400 μm. (H) The strongest pNDRG1‐positive cells appear to have spindle‐shaped morphology resembling stromal cells. Bar = 100 μm.
